
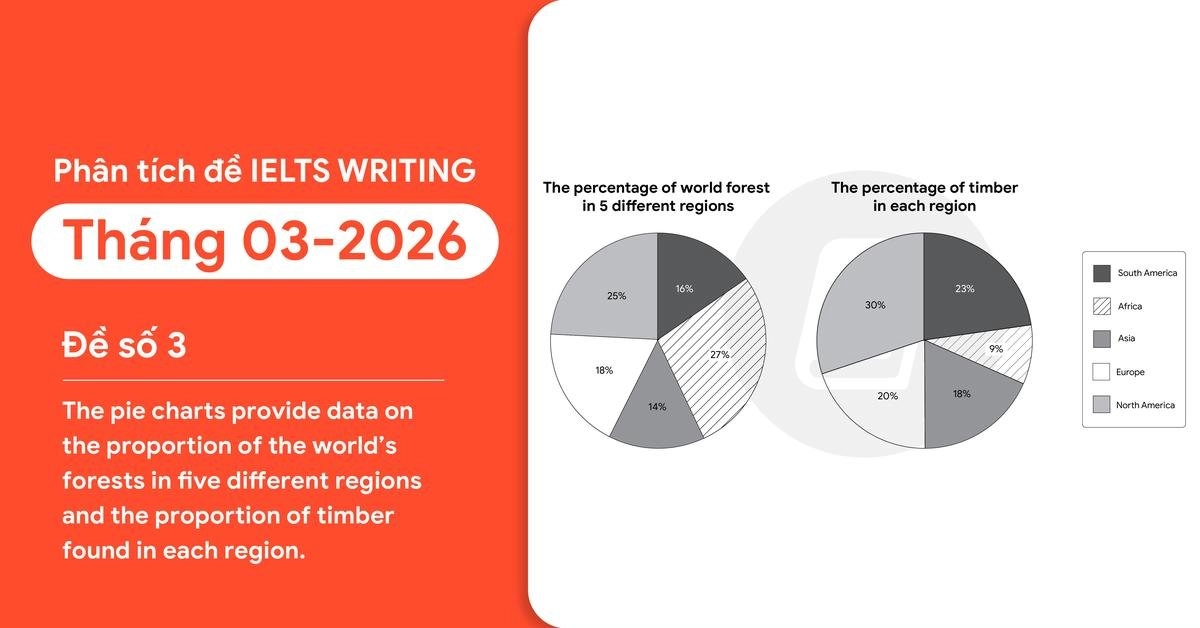
The provided pie chart illustrates the percentages of world forest and timber recorded in five different regions (South America, Africa, Asia, Europe and North America). Overall, there are noticeable differences in the proportions of world forest and timber in each region. Notably, the figures for timber found in South America, Asia, Europe and North America are higher than those for world forest, whereas the data for world forest recorded in Africa shows the opposite pattern. Examining the details more closely, 30% of timber is found in North America, compared to 25% of world forest. However, the percentage of world forest recorded in Africa, standing at 27%, is higher than that for timber (9%). Turning to the remaining categories, the proportion of timber found in Asia stands at 18%, followed by world forest with 14%. In addition, the figure for timber in Europe is slightly higher than that for world forest, at 20% and 18%, respectively. Finally, South America follows a similar pattern, with 23% of timber and 16% of world forest.
Sample Detail
The pie charts provide data on the proportion of the world’s forests in five different regions and the proportion of timber found in each region
21/07/2026 15:58 7.0 points
Topic
The pie charts provide data on the proportion of the world’s forests in five different regions and the proportion of timber found in each region
Word count: 171
Chart/Graph
Essay
Overall Scores
7.0±0.5
Good
Writing Criteria Scores
TA7.0
CC7.0
LR7.0
GRA8.0
Click on any highlighted text in the essay to view detailed suggestions for improvement.
Deep Analysis
Task 1 - Academic Writing
4 tools available
Sample Essay - IELTS Writing Task 1
No sample essay
Click the button below to analyze and generate a high-quality sample essay for Task 1.