
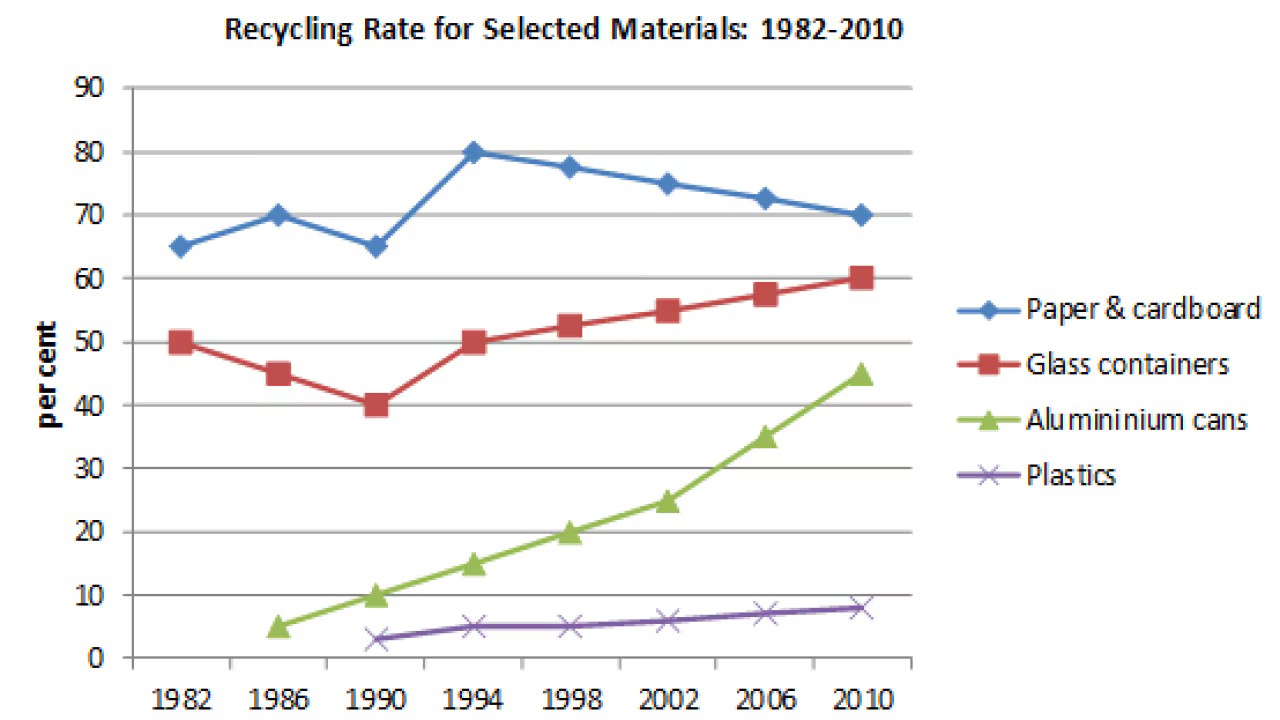
The given line graph illustrates the recycling rate for selected materials during the period of 1982 -2010. Overall, all four categories experience an upward trend. It is worth noting that although the figures changed over time, the relative ranking of the four categories remained unchanged. The rate of recycled paper and cardboard began at 65% and experienced a slight growth of 5 percent in 1985. After an upsurge of 15% from 1990 to 1994, it continued a decline from 1994 to 2010, ending at 70%. The percentage of recycled glass containers dropped from 50% to 40% from 1982 to 1986 before recovering to its initial level in 1994. From then onwards, the figure has risen steadily to 60%. Starting at 5% in 1986, the proportion of aluminium cans rose consistently throughout the period. From 2002 onwards, recycling rate of aluminium cans increased at a faster rate, standing at approximately 45% in 2010. The rate of recycled plastics, however, saw a much less significant rise. It remained relatively stable, increasing only at around 6% over the period.
Sample Detail
The graph below shows the recycling rates of selected materials: paper and cardboard, glass containers, aluminium cans and plastics between 1982 and 2010. Summarise the information by selecting and reporting the main features, and make comparisons where relevant.
21/07/2026 16:12 7.0 points
Topic
The graph below shows the recycling rates of selected materials: paper and cardboard, glass containers, aluminium cans and plastics between 1982 and 2010. Summarise the information by selecting and reporting the main features, and make comparisons where relevant.
Word count: 176
Chart/Graph
Essay
Overall Scores
7.0±0.5
Good
Writing Criteria Scores
TA7.0
CC7.0
LR7.0
GRA7.0
Click on any highlighted text in the essay to view detailed suggestions for improvement.
Deep Analysis
Task 1 - Academic Writing
4 tools available
Sample Essay - IELTS Writing Task 1
No sample essay
Click the button below to analyze and generate a high-quality sample essay for Task 1.