
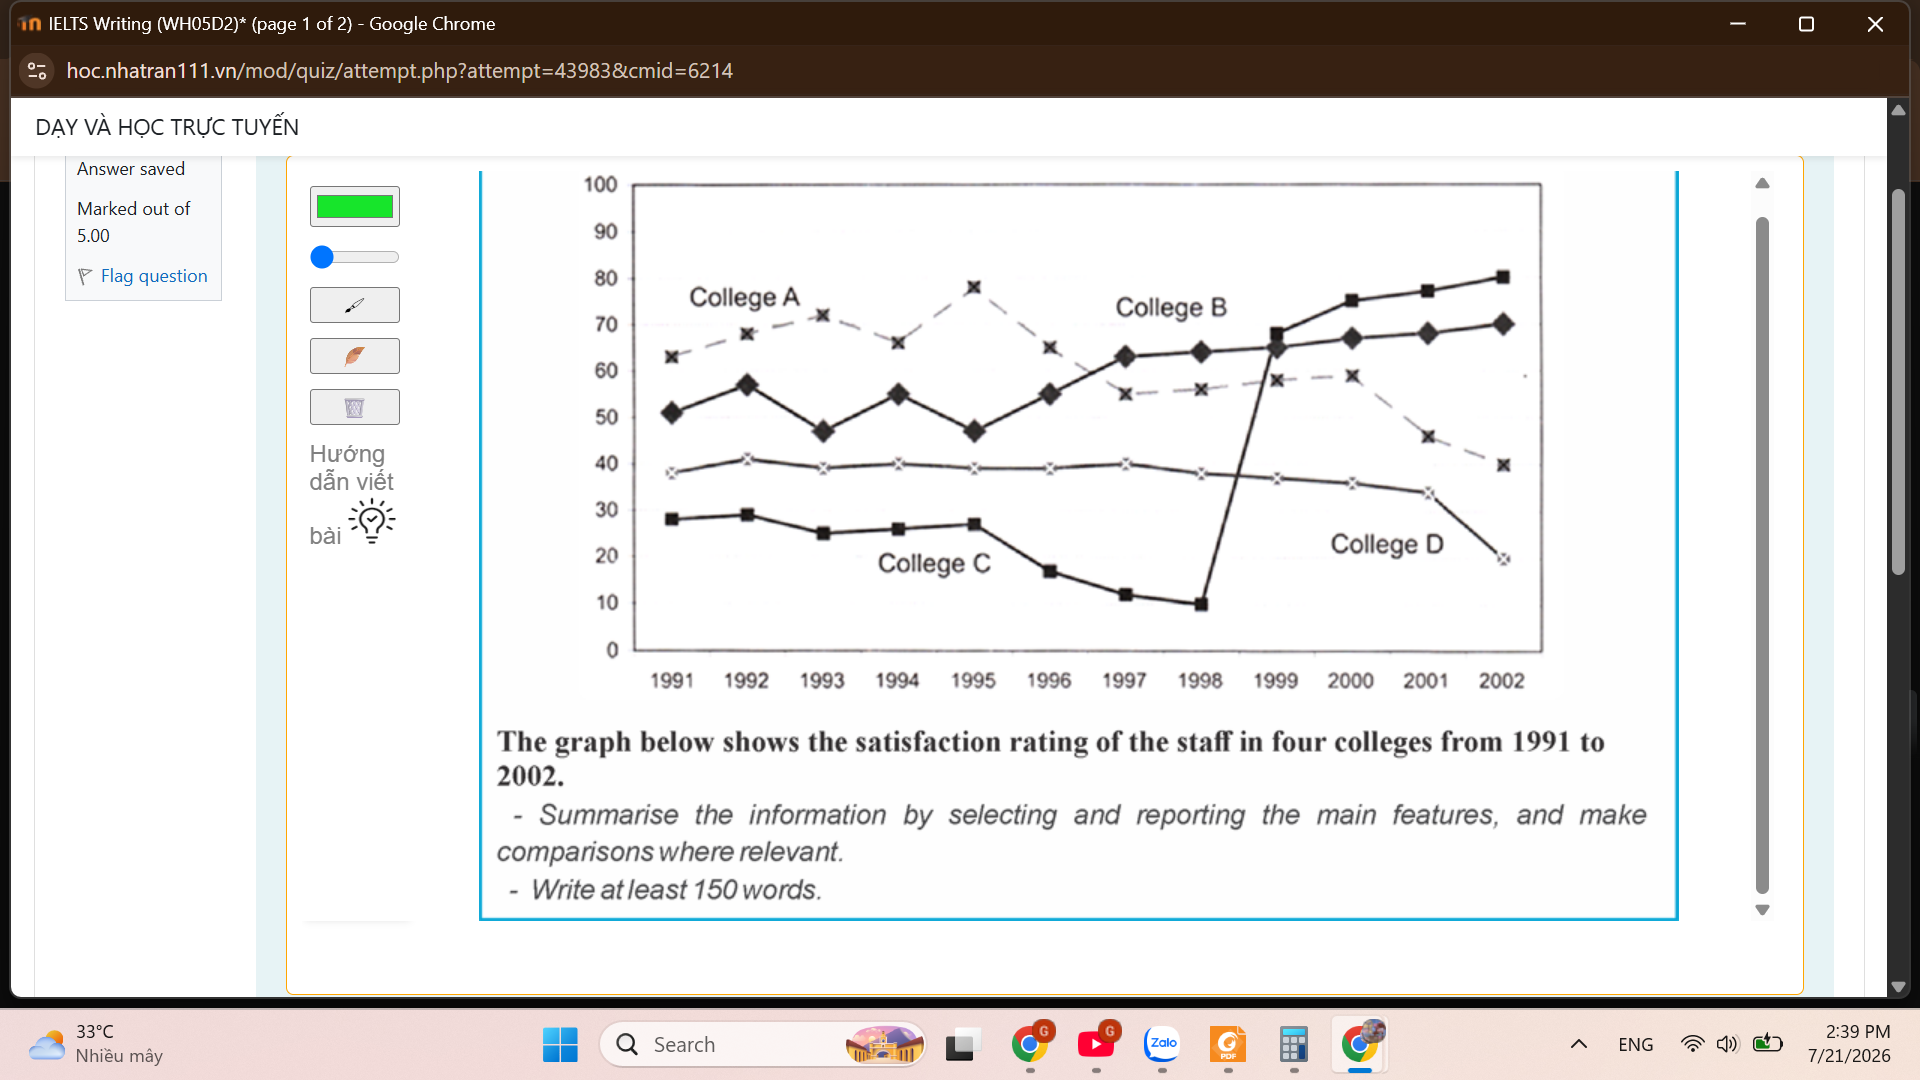
The line graph compares employees' job satisfaction in four distinct colleges over an 11-year period starting from 1991. Looking at the graph from an overall persective, it is clear that while both the figure for staffs' satisfaction in both college B and college C experienced an upward trend by the end of the timeframe, the opposite was true for the figure in college A and college B. Although the rating of job satisfaction in college C was the lowest at first, it surpassed all its counterparts and became the highest figure as the period came to close. Focusing on the job satisfaction of the staff, not until 1999 did the amount of career fulfillment in college C show any significant changes, when it dramatically shoot up to 70%, which is a significant rise of 60% comparing to the period between 1991 to 1998. Its development of proportion still witnessed a stable upward trend and reached 80% in 2002. Following by the proportion of job satisfaction in college B, at first the rating of workplace fulfillment moved up and down. However, it became to stay the same, which around 60%, from 1997 to the conclusion of the period. Turning to the proportion of career satisfaction in college A and college D, it is obvious that even though the proportion in college A was the highest at the beginning, it experienced some fluctuations before staying constant and dropping to 40% in the final year. Meanwhile, the volme of job satisfaction in college D plateaued in most of the period time and ended at 20%.
Sample Detail
The graph below shows the satisfaction rating of the staff in four colleges from 1991 to 2002. Summarise the information by selecting and reporting the main features, and make comparisons where relevant. Write at least 150 words.
21/07/2026 16:16 5.5 points
Topic
The graph below shows the satisfaction rating of the staff in four colleges from 1991 to 2002. Summarise the information by selecting and reporting the main features, and make comparisons where relevant. Write at least 150 words.
Word count: 262
Chart/Graph
Essay
Overall Scores
5.5±0.5
Basic
Writing Criteria Scores
TA5.0
CC6.0
LR5.0
GRA6.0
Click on any highlighted text in the essay to view detailed suggestions for improvement.
Deep Analysis
Task 1 - Academic Writing
4 tools available
Sample Essay - IELTS Writing Task 1
No sample essay
Click the button below to analyze and generate a high-quality sample essay for Task 1.