
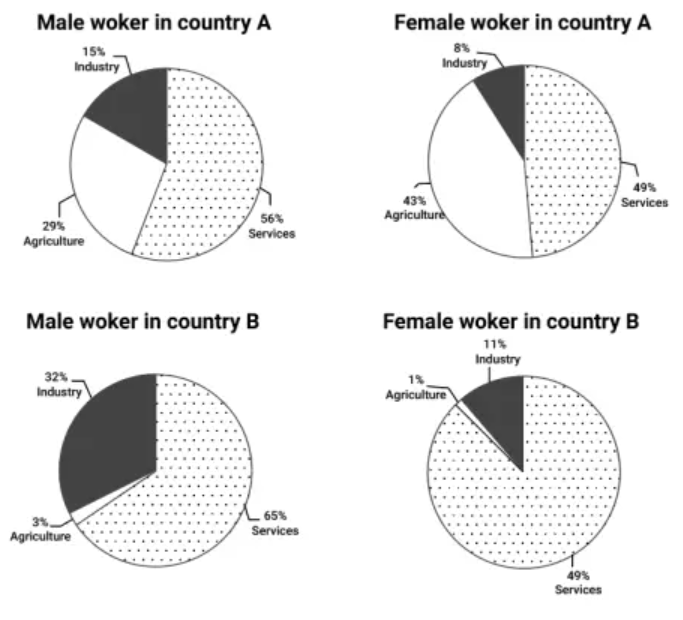
The provided pie charts reveal the proportion of workers, depending on gender, who spend time on different fields in countries A and B. Notably, it can be observed that services emerge as the predominant category of all the graphs in the survey. With regards to the total number of male employees, it is worth pointing out that services rank first in both countries A and B, accounting for marginally above a half and slightly under one-third respectively, additionally far surpassing others. This was followed by agriculture and industry in country A with figures registering at 29% and 15%, while the corresponding figures for country B are 10 times lower than that of A and almost double the other, in that order. Shifting the focus to the total figure for female employees in both governments, apparently, it showcases a dissimilar pattern. One marked disparity is recorded in agriculture as it comprises 42% higher in A than that of B, likewise, industry exhibits a less notable share, being 8% in A compared to 11% of country B. In contrast, the totals of female workers in both countries are the same, standing at slightly below a half. However, in country B, the remaining females have no impact on working.
নমুনা বিস্তারিত
The charts below show the percentage of male and female workers in country A and country B.
21/07/2026 16:27 6.0 স্কোর
টপিক বা বিষয়
The charts below show the percentage of male and female workers in country A and country B.
শব্দ সংখ্যা: 206
চার্ট/গ্রাফ
Essay
সামগ্রিক স্কোর
6.0±0.5
মোটামুটি
রাইটিং মানদণ্ড স্কোর
TA6.0
CC6.0
LR6.0
GRA6.0
উন্নতির জন্য বিস্তারিত পরামর্শ দেখতে প্রবন্ধের হাইলাইট করা যেকোনো লেখায় ক্লিক করুন।
গভীর বিশ্লেষণ
Task 1 - Academic Writing
4 tools available
নমুনা রচনা - IELTS Writing Task 1
কোনো নমুনা রচনা নেই
টাস্ক ১-এর জন্য উচ্চমানের নমুনা রচনা বিশ্লেষণ এবং তৈরি করতে নিচের বাটনে ক্লিক করুন।