
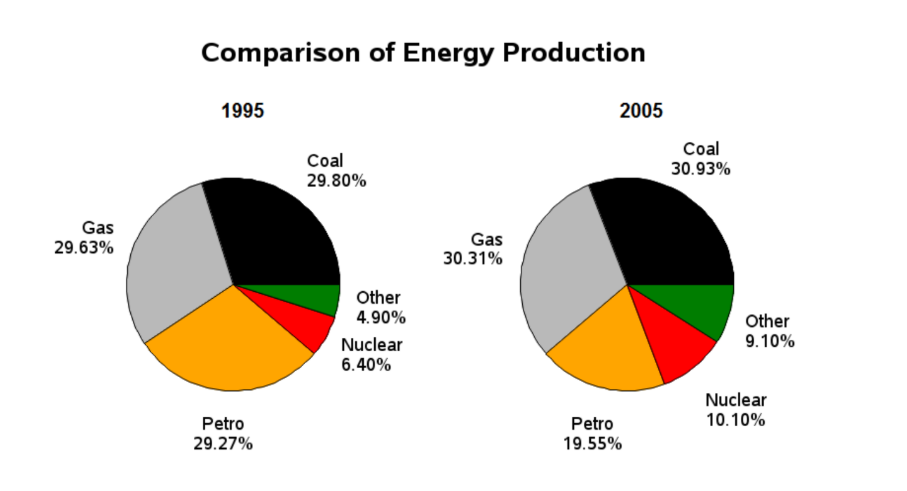
The two pie charts compare the energy production using different resources, namely coal, petrol, gas, nuclear and other sources. The data was recorded in a specific European country in 1995 and 2005. Overall, coal and gas were the main sources of production in both years. Petrol was also popular in 1995, however, the proportion for this sector fell significantly by 2005. Despite being the least prevalent sources in the first, the shares for nuclear and other types rose in 2005. In 1995, there was a priority for the use of gas, coal and petrol. The figures for these three sectors were quite similar, with 29.63%, 29.8% and 29.27%, respectively. In the next decade, coal and gas increased slightly to 30.93% and 30.31%, placing them above petrol, at 19.55% In contrast, other sources accounted for a modest 4.9% of total energy production in 1995, however, their data increased to 9.1% in 2005.Following the same trend, nuclear power rose from 6.4% to 10.1% over the period. This was an increase of 3.7 percentage points, compared with a 4.2-percentage-point rise in the figure for other sources.
नमूना विवरण
The pie charts above show a comparison of kinds of energy production in a European country in 1995 and 2005.
21/07/2026 16:36 7.0 अंक
विषय
The pie charts above show a comparison of kinds of energy production in a European country in 1995 and 2005.
शब्दों की संख्या: 183
चार्ट/ग्राफ
Essay
समग्र स्कोर
7.0±0.5
अच्छा
राइटिंग मानदंड स्कोर
TA7.0
CC7.0
LR7.0
GRA7.0
सुधार के विस्तृत सुझाव देखने के लिए लेख में किसी भी हाइलाइट किए गए टेक्स्ट पर क्लिक करें।
गहन विश्लेषण
Task 1 - Academic Writing
4 उपकरण उपलब्ध
नमूना लेख - IELTS Writing Task 1
कोई नमूना लेख नहीं
Task 1 के लिए उच्च-गुणवत्ता वाला नमूना लेख विश्लेषण और बनाने के लिए नीचे दिए गए बटन पर क्लिक करें।