
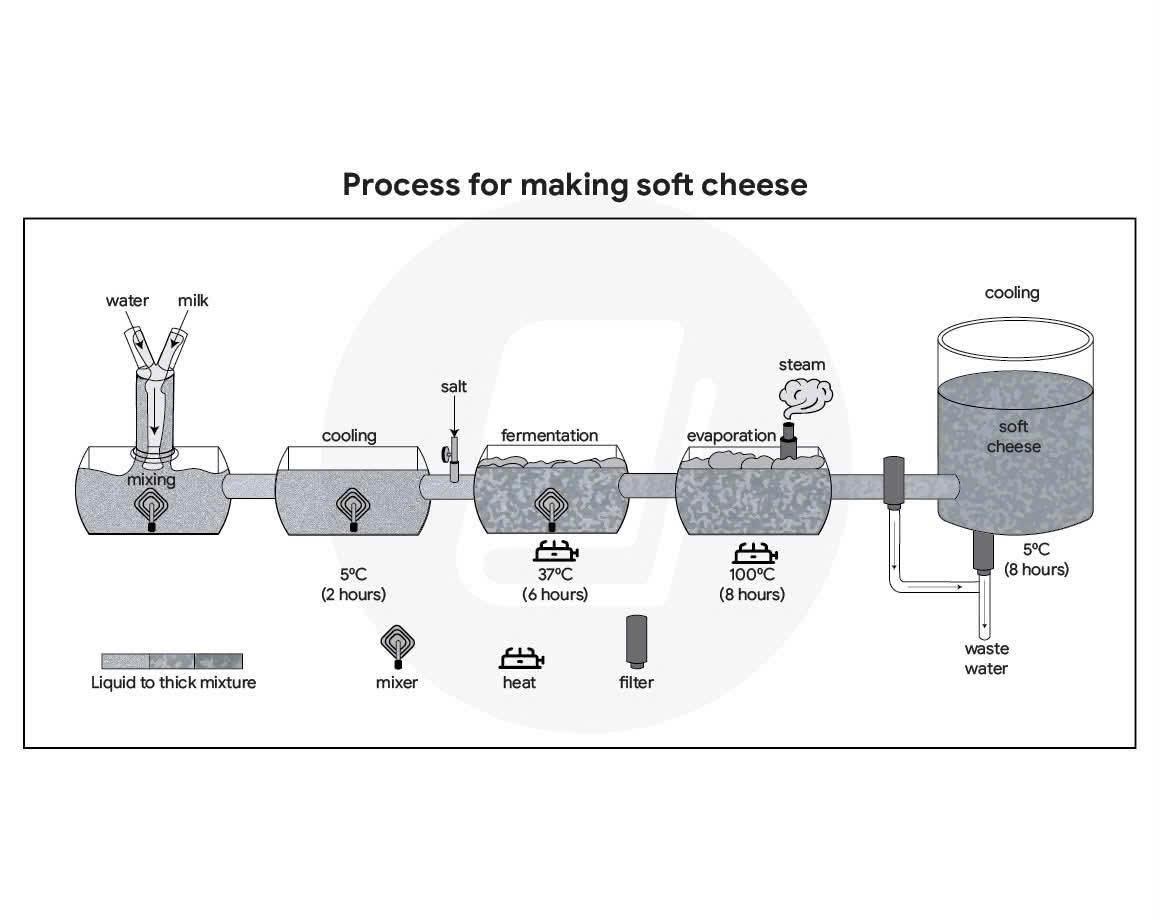
The diagram illustrates how soft cheese is produced. Looking from an overall perspective, this is a linear, man-made process, comprising five main stages and taking approximately one day. More specifically, the entire process commences with the blending of raw ingredients and culminates with the final cooling to produce soft cheese. Regarding the first half of the process, milk and water are poured into a mixing chamber to be thoroughly blended before a 2-hour refrigeration at 5 degrees Celsius. Following that, salt is added to the mixture to initiate the fermentation phase at a temperature of 37 degrees Celsius. Over six hours, once chemical reactions occur, the liquid transforms into a thickened product, primed for the subsequent stage. Concerning the remaining part of the process, after fermentation, the semi-liquid substance undergoes an evaporation phase for a duration of 8 hours at the boiling point of water. As the water almost completely evaporates, the thickened mixture is channeled into a cooling tank, where it rests at 5 degrees Celsius for another 8 hours. During this stage, the waste water is removed through two outlet, effectively filtering devices.
Sample Detail
The diagram below shows the process of making soft cheese. Summarise the information by selecting and reporting the main features and make comparisons where relevant.
21/07/2026 16:38 7.0 points
Topic
The diagram below shows the process of making soft cheese. Summarise the information by selecting and reporting the main features and make comparisons where relevant.
Word count: 185
Chart/Graph
Essay
Overall Scores
7.0±0.5
Good
Writing Criteria Scores
TA7.0
CC7.0
LR7.0
GRA7.0
Click on any highlighted text in the essay to view detailed suggestions for improvement.
Deep Analysis
Task 1 - Academic Writing
4 tools available
Sample Essay - IELTS Writing Task 1
No sample essay
Click the button below to analyze and generate a high-quality sample essay for Task 1.