
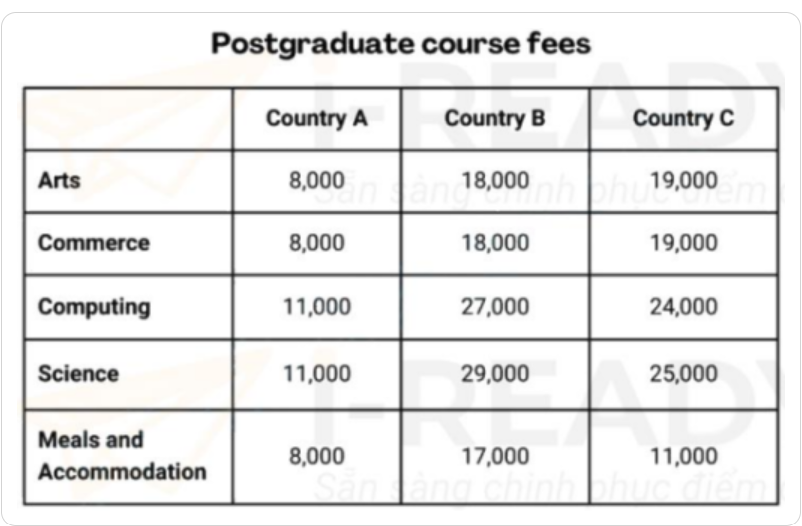
The given table illustrates the amount of money spent for different graduate programs by abroad students in three countries in 2017. Overall, science and is the most expensive courses in all countries, followed by computing, while the opposite was true for meals and accommodation. Also, the cost expended to arts and commerce have a striking similar. In area A, the prices of arts, and commerce, which pupils need to spend is 8.000, while these programs require people in other countries spend more than twice as much as, around at 18.000 and 19.000 respectively. Moreover, this financial cost of meals and accommodation in A is just 8000 compared to nation C standing at 11.000. Additionally, this figure for country B is the highest price, leaving A and C behind. Besides, the academic cost of science in nation B, accounting for 29.000 is the most expensive compared to others. Furthermore, this data is higher nearly 3 times as much as the expenditure of this industry in country A, but the gap between it and C stands at mere 4.000. Also, the tuition fees for computing in A is 16.000 lower than B, while this data in nation C need to spend more than double, comprising 24.000.
Sample Detail
The table show the the postgraduate course fees that international students paid in three countries in 2007.
21/07/2026 16:49 6.0 points
Topic
The table show the the postgraduate course fees that international students paid in three countries in 2007.
Word count: 204
Chart/Graph
Essay
Overall Scores
6.0±0.5
Fair
Writing Criteria Scores
TA6.0
CC6.0
LR6.0
GRA6.0
Click on any highlighted text in the essay to view detailed suggestions for improvement.
Deep Analysis
Task 1 - Academic Writing
4 tools available
Sample Essay - IELTS Writing Task 1
No sample essay
Click the button below to analyze and generate a high-quality sample essay for Task 1.