
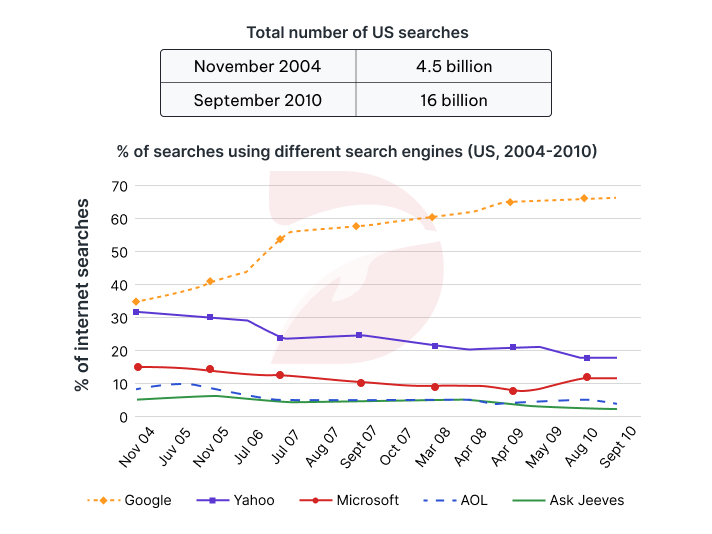
The table and line chart illustrates the number of searches using different search engines in the US over the six-year period from 2004 to 2010. Overall, the total number of Internet searches in the US between 2004 and 2010 skyrocketed approximately by 11.5 billion from 4.5 billion to 16 billion, a significant recording. Specifically, Google witnessed the most dramatic increase for the majority of the period. Meanwhile, other engines saw a reverse trend with substantially declined figures. In 2004, the percentage of searches using Google achieved the highest, approximately 35%, taking the initial top position. Followed by Yahoo, which had the second-highest percentage of usage, around 31%. These were two of the popular search engines in the initial year. Next was Microsoft with a percentage of usage standing at merely about 15%. AOL was the next one, its prevalence in use under 10%. And the last was Ask Jeeves, which registered the lowest figure at approximately 5% for searching. Over the following six years, Google from a clear search engine leader, witnessed a sharp rise during the period from about 35% to more than 65% of Internet searches in the final year and remained in its initial top position. About Yahoo, compared with Google, Yahoo found the sharp contrast when it saw a constant decline for the majority of the period from around 30% in 2004 to under 20% in 2010. Microsoft saw a slow and steady reduction of approximately 5% from initial year to 2009, and this was followed by a modest rise in the months that followed in 2009 and into 2010. Next to AOL, stemming from percentage of searches standind at a mere around 9%, after which this figure showed slight fluctuations and secured its position in the end of the cycle. Finally, although Ask Jeeves experienced a slow and steady fluctuations during the period, it remained the lowest and reached a low figure of usage for searching in the US from 2004 to 2010.
รายละเอียดตัวอย่าง
The table and graph below give information about Internet searches in the US between 2004 and 2010. Summarize the information by selecting and reporting the main features, and make comparisons where relevant.
21/07/2026 16:50 6.5 คะแนน
หัวข้อ
The table and graph below give information about Internet searches in the US between 2004 and 2010. Summarize the information by selecting and reporting the main features, and make comparisons where relevant.
จำนวนคำ: 328
แผนภูมิ/กราฟ
Essay
คะแนนรวม
6.5±0.5
ดีพอใช้
คะแนนเกณฑ์การเขียน
TA7.0
CC7.0
LR6.0
GRA7.0
คลิกข้อความที่ไฮไลต์ในเรียงความเพื่อดูคำแนะนำรายละเอียดเพื่อพัฒนา
การวิเคราะห์เชิงลึก
Task 1 - Academic Writing
4 tools available
บทความตัวอย่าง - IELTS Writing Task 1
ยังไม่มีบทความตัวอย่าง
กดปุ่มด้านล่างเพื่อวิเคราะห์และสร้างบทความตัวอย่างคุณภาพสูงสำหรับ Task 1