
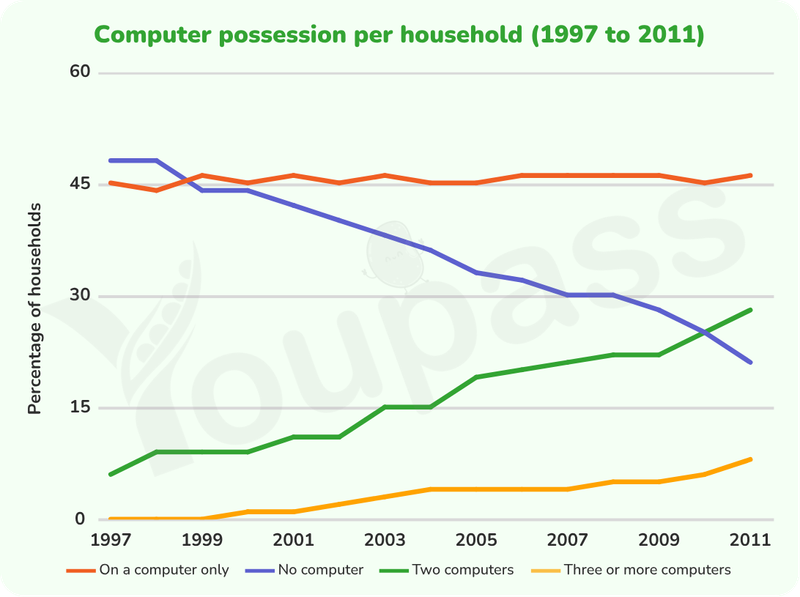
The line chart illustrates the proportion of households that owned a computer in a European country from 1997 to 2011. Overall, what stands out from the chart is that the percentage of households with no computers decreased significantly, while the ownership of two or more computers saw a steady upward trend. Moreover, single-computer a computer show a consistent popularity throughout the period. In terms of the data of single-computer households and those without a computer accounted for the highest proportions for most of the period. Nearly 48% of households did not buy any computer in the first two years. Then, it declined noticeably to about 23% in 2011. Although ranking second from 1997 to 1999, the figure for single-computer households fluctuated around 45%, surpassing those of no computer in order to rank first in the final year. Regarding households with two computers and those with three or more computers followed a similar upward trend. Initially, the ownership of two computers stood at 6%, followed by a dramatic surge to approximately 30%, overtaking those of no computer in the last two years. Lastly, the percentage of households possessing more than three computers remained a consistent rate at 0%, prior to a slight rise to 8% in 2011.
รายละเอียดตัวอย่าง
The graph below gives information about computer possession by household in one European country between 1997 and 2011. Summarise the information by selecting and reporting the main features, and make comparisons where relevant.
21/07/2026 16:53 7.0 คะแนน
หัวข้อ
The graph below gives information about computer possession by household in one European country between 1997 and 2011. Summarise the information by selecting and reporting the main features, and make comparisons where relevant.
จำนวนคำ: 206
แผนภูมิ/กราฟ
Essay
คะแนนรวม
7.0±0.5
ดีมาก
คะแนนเกณฑ์การเขียน
TA7.0
CC7.0
LR7.0
GRA7.0
คลิกข้อความที่ไฮไลต์ในเรียงความเพื่อดูคำแนะนำรายละเอียดเพื่อพัฒนา
การวิเคราะห์เชิงลึก
Task 1 - Academic Writing
4 tools available
บทความตัวอย่าง - IELTS Writing Task 1
ยังไม่มีบทความตัวอย่าง
กดปุ่มด้านล่างเพื่อวิเคราะห์และสร้างบทความตัวอย่างคุณภาพสูงสำหรับ Task 1