
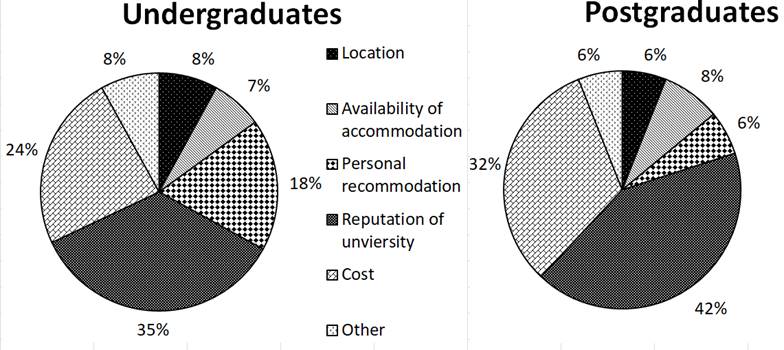
The provided pie charts reveal the proportion of undergraduates and postgraduates who decide on going to Parker University for various motives. Notably, it can be observed that the reputation of university emerges as the predominant incentive of both groups in the survey. With regards to the number of undergraduate learners, it is worth pointing out that the Parker University's prestige ranks first, accounting for marginally above one-third and far surpassing others. This is followed by the cost and the personal recommodation with figures registering at slightly less than a quarter and 18% respectively. The lowest data can be seen in the availability of accommodation, which occupies a mere of 7%, slightly lower than the remaining categories. Shifting the focus to the total figure for students pursuing postgraduate degrees, apparently, it showcases a dissimilar pattern. One marked disparity is recorded in the university's academic reputation, as it comprises 7% lower than that of undergraduates; likewise, the cost exhibits a more notable share, being 32% compared to 24% of undergraduate students. In contrast, the total of postgraduate learners which is alloted to personal recommodation stands at 6%, while the corresponding figure for undergraduates is triple that.
รายละเอียดตัวอย่าง
The charts show the reasons why undergraduates and postgraduates choose to go to Parker University.
21/07/2026 16:53 6.5 คะแนน
หัวข้อ
The charts show the reasons why undergraduates and postgraduates choose to go to Parker University.
จำนวนคำ: 194
แผนภูมิ/กราฟ
Essay
คะแนนรวม
6.5±0.5
ดีพอใช้
คะแนนเกณฑ์การเขียน
TA6.0
CC7.0
LR6.0
GRA7.0
คลิกข้อความที่ไฮไลต์ในเรียงความเพื่อดูคำแนะนำรายละเอียดเพื่อพัฒนา
การวิเคราะห์เชิงลึก
Task 1 - Academic Writing
4 tools available
บทความตัวอย่าง - IELTS Writing Task 1
ยังไม่มีบทความตัวอย่าง
กดปุ่มด้านล่างเพื่อวิเคราะห์และสร้างบทความตัวอย่างคุณภาพสูงสำหรับ Task 1