
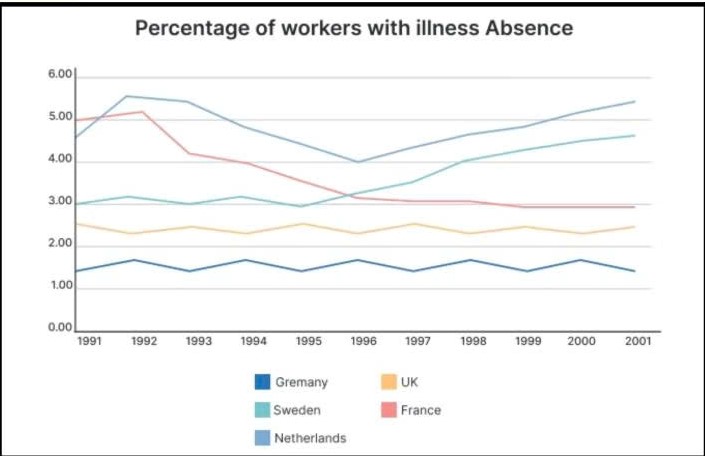
The line graph illustrates the proportion of employees who took more sickness-related absences in five different European countries every year between 1991 and 2001. Overall, the percentage of workers in the Netherlands and Sweden recorded a consistent and dramatic rise over the period, while France showed the opposite trend. In addition, the UK and Germany remained relatively stable until the final year. The highest levels of sickness absence were recorded in the Netherlands at around 4.7% in 1991 and increased slightly to 5.5% in the following year. It then fell gradually to exactly 4% in 1996, before spiking sharply to nearly 5.4% at the end of the period. Additionally, Sweden accounted for 3% in 1991 and remained unchanged until 1995. After that, it increased dramatically by 2.7%, reaching 5.7% in 2001 in a distant second place. The UK and Germany followed a similar pattern, they stood at 2.5% and 1.3% respectively. Then both countries witnessed slight fluctuations over the period, before recovering their initial level in 2001. By contrast, the percentage of employees in France, which recorded the lowest proportion. In 1991, it accounted for 5% and climbed negligibly to roughly 5.1% in 1992. Then it dropped steeply to around 3% in 1997, before remaining unchanged until 2001.
Detail Sampel
The graph line below shows the percentage of workers in five European countries taking fixed stays or more sickness absences per year from 1991 to 2001.
21/07/2026 17:12 6.5 skor
Topik
The graph line below shows the percentage of workers in five European countries taking fixed stays or more sickness absences per year from 1991 to 2001.
Jumlah kata: 208
Grafik/Diagram
Essay
Skor Keseluruhan
6.5±0.5
Cukup
Skor Kriteria Writing
TA7.0
CC7.0
LR7.0
GRA6.0
Klik teks yang ditandai di esai untuk melihat saran detail untuk peningkatan.
Analisis mendalam
Task 1 - Academic Writing
4 tools available
Esai contoh - IELTS Writing Task 1
Belum ada esai contoh
Silakan klik tombol di bawah untuk menganalisis dan membuat esai contoh berkualitas tinggi untuk Task 1.