
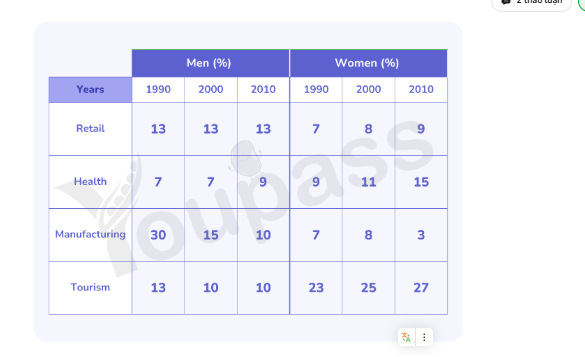
Bài gốc The chart provides information about the percentage of people specialists in various kinds of enterprises over a period of 20 years from 1990 to 2010. In general, it is clear that the average women requirements showed an upward trend.Also, the average for male and female both witnessed a decrease in manufacturing, while the percentage of tourism in women showed the highest preference. Regarding men, the proportion of men in manufacturing was the largest number to 30% in 1990, but later declined sightly to 10% in 2010. The mean male in health remain unchanged from 1990 to 2000 and continued to increase , standing at 9% in 2010. By contrast, manufacturing also accounted for 13% in 1990, before declined and remained stable , with 10% in 2010. Meanwhile, retail levelled off between 1990 and 2010,constituting to 13%. To women,tourism was most popular item, had significantly increased from 23% to 27%.The retail also grew up and only a small gap, was 1%, while health had large app, approximately 3%. Besides, there was a rose to 8 in the number of men about manufacturing in 2000, which was followed an b decrease to 3% in 2010.
รายละเอียดตัวอย่าง
The table beneath shows the level of people specialists in various kinds of enterprises in 1990, 2000, and 2010. Sum up the data by choosing and writing about the primary capacities and make correlations where fitting.
21/07/2026 17:15 5.0 คะแนน
หัวข้อ
The table beneath shows the level of people specialists in various kinds of enterprises in 1990, 2000, and 2010. Sum up the data by choosing and writing about the primary capacities and make correlations where fitting.
จำนวนคำ: 195
แผนภูมิ/กราฟ
Essay
คะแนนรวม
5.0±0.5
พื้นฐาน
คะแนนเกณฑ์การเขียน
TA5.0
CC6.0
LR5.0
GRA5.0
คลิกข้อความที่ไฮไลต์ในเรียงความเพื่อดูคำแนะนำรายละเอียดเพื่อพัฒนา
การวิเคราะห์เชิงลึก
Task 1 - Academic Writing
4 tools available
บทความตัวอย่าง - IELTS Writing Task 1
ยังไม่มีบทความตัวอย่าง
กดปุ่มด้านล่างเพื่อวิเคราะห์และสร้างบทความตัวอย่างคุณภาพสูงสำหรับ Task 1