
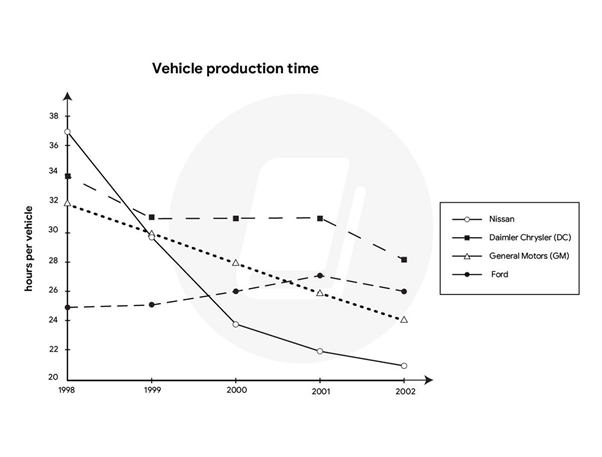
The line graph presents the number of time to produce a vehicle by four car manufacturers in the USA from 1998 to 2002. Overall, the amount of time taken to manufacture a vehicle by Nissan, Daimler Chrysler (DC) and General Motors (GM) is on a downward trend, while production time of Ford is on an upward trend in the beginning of the period. The proportion of production time of Ford increased from 25 to nearly 26. In contrast, each others were on decline, DC and GM decreased by around 2 hours in 1 years, whereas manufacturing time of Nissan fell down dramatically by around 7 hours (from 37 to 30). In the next 2 years, the amount of vehicle production time of Ford rose around 2 hours, followed by a grow to nearly 32 in the figure of time of DC. Between 1999 and 2001, GM dropped to 26 and Nissan declined significantly to around 22 hours. However, the number of time taken to produce by Ford grew gradually and reached a peak of 27 hours per vehicle. In the same period, DC was on a stable which reached at nearly 32 from 1999 to 2001. After that, it decreased to over 28 which took the first place in 2002. In the last period, all of them were on a fall, Nissan reached at around 21 hours which is a producer having the lowest time to manufacture a vehicle. The rate of production time of Ford dropped slightly to over 26, followed by the similar trend in GM which fell 2 hours (from 26 to 24) between 2001 and 2002.
नमूना विवरण
The chart below gives information on the amount of time taken to manufacture a vehicle by four US-based car producers between 1998 and 2002.Provide an overview of the information by identifying and describing the key details, and include comparisons where appropriate.
21/07/2026 17:28 6.0 अंक
विषय
The chart below gives information on the amount of time taken to manufacture a vehicle by four US-based car producers between 1998 and 2002.Provide an overview of the information by identifying and describing the key details, and include comparisons where appropriate.
शब्दों की संख्या: 270
चार्ट/ग्राफ
Essay
समग्र स्कोर
6.0±0.5
ठीक
राइटिंग मानदंड स्कोर
TA6.0
CC6.0
LR6.0
GRA6.0
सुधार के विस्तृत सुझाव देखने के लिए लेख में किसी भी हाइलाइट किए गए टेक्स्ट पर क्लिक करें।
गहन विश्लेषण
Task 1 - Academic Writing
4 उपकरण उपलब्ध
नमूना लेख - IELTS Writing Task 1
कोई नमूना लेख नहीं
Task 1 के लिए उच्च-गुणवत्ता वाला नमूना लेख विश्लेषण और बनाने के लिए नीचे दिए गए बटन पर क्लिक करें।