
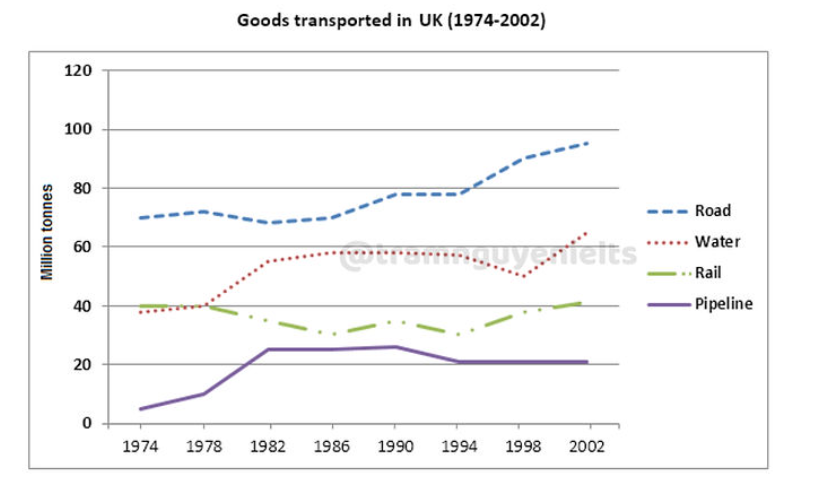
The line graph illustrates the number of goods transported in the UK by four distinct means of transportation including road, water, rail, and pipeline from 1974 to 2002. Overall, it is observed that there were three modes recording an upward trend, with the exception for rail experiencing fluctuations. Notably, goods transported by road predominated throughout the period. Commencing with road, it held a leading position with around 70 million in 1974 before experiecing a slight decline and hit the bottom of about 67 million in 1982s. This figure was followed by a significant growth and ultimately reached a high of approximately 96 million in 2002. Water transportation commenced 39 million in the initial year before substantially rising to nearly 59 million in 1982. This number remained relatively stable until 1994, it fallen considerably to around 50 million in 1998, which was followed by a surge to 64 million at the end of the period. Turning to the remaining modes, rail remained unchanged from 1974 to 1978 before experiencing an oscillation around 35 million, reaching a minimum of 30 million in 1994s and ultimately growing to over 40 million in 2002. The lowest figure was recorde in transporting goods by pipeline, with around 4 million initially before surging dramatically to about 24 million in 1982 and experieced a marginal decline to 20 million in 2002.
नमूना विवरण
The graph below depicts the quantities of goods transported in the UK between 1974 and 2002 across four different modes of transportation. Summarize the information by selecting and reporting the key features, and draw relevant comparisons where necessary.
21/07/2026 17:54 7.0 अंक
विषय
The graph below depicts the quantities of goods transported in the UK between 1974 and 2002 across four different modes of transportation. Summarize the information by selecting and reporting the key features, and draw relevant comparisons where necessary.
शब्दों की संख्या: 224
चार्ट/ग्राफ
Essay
समग्र स्कोर
7.0±0.5
अच्छा
राइटिंग मानदंड स्कोर
TA7.0
CC7.0
LR7.0
GRA7.0
सुधार के विस्तृत सुझाव देखने के लिए लेख में किसी भी हाइलाइट किए गए टेक्स्ट पर क्लिक करें।
गहन विश्लेषण
Task 1 - Academic Writing
4 उपकरण उपलब्ध
नमूना लेख - IELTS Writing Task 1
कोई नमूना लेख नहीं
Task 1 के लिए उच्च-गुणवत्ता वाला नमूना लेख विश्लेषण और बनाने के लिए नीचे दिए गए बटन पर क्लिक करें।