
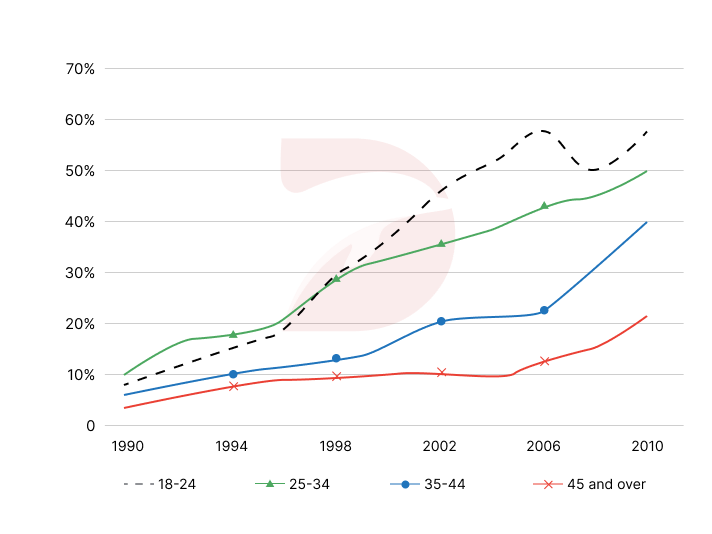
The chart above illustrates the people of various ages going to gyms once a month or more from 1990 to 2010 in Europe. Overall, there are upward trend in all of the number of inhabitants going to the fitness clubs. Otherwise, adults between 18 – 34 seem to visit more than others age groups. The percentage of people from 18 to 24 and 25 to 34 started at about 10%. The next 8 years, they both increased significantly and hit 30%. Then, the number of adults between 18-24 took the leading position. After a fluctuate between 50% and 60%, it reached 60% in 2010. Likewise, the rate of people from 25 to 34 went up to 50% in the last year. Otherwise, after the beginning at about 4% in 1990, the percentage of inhabitants older than 44 going to the gyms levelled of at 10%. Then, it increased to more than 20% in 2010. The number of people from 35 to 44 started at 5%. After a noticeable rise by nearly 35%, this figure reached the third position of 40%.
নমুনা বিস্তারিত
The chart below gives information about European people of different age groups who went to gyms once a month or more between 1990 and 2010.
21/07/2026 18:03 6.5 স্কোর
টপিক বা বিষয়
The chart below gives information about European people of different age groups who went to gyms once a month or more between 1990 and 2010.
শব্দ সংখ্যা: 180
চার্ট/গ্রাফ
Essay
সামগ্রিক স্কোর
6.5±0.5
মোটামুটি
রাইটিং মানদণ্ড স্কোর
TA7.0
CC7.0
LR6.0
GRA7.0
উন্নতির জন্য বিস্তারিত পরামর্শ দেখতে প্রবন্ধের হাইলাইট করা যেকোনো লেখায় ক্লিক করুন।
গভীর বিশ্লেষণ
Task 1 - Academic Writing
4 tools available
নমুনা রচনা - IELTS Writing Task 1
কোনো নমুনা রচনা নেই
টাস্ক ১-এর জন্য উচ্চমানের নমুনা রচনা বিশ্লেষণ এবং তৈরি করতে নিচের বাটনে ক্লিক করুন।