
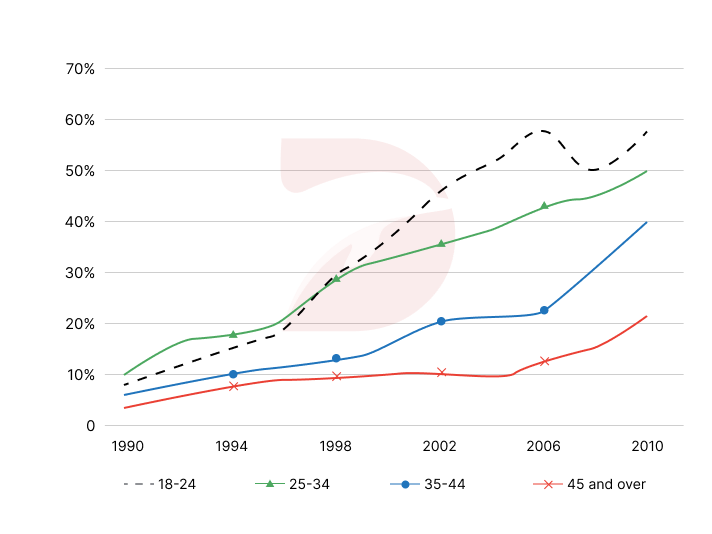
The chart above illustrates the people of various ages going to gyms once a month or more from 1990 to 2010 in Europe. Overall, there are upward trend in all of the number of inhabitants going to the fitness clubs. Otherwise, adults between 18 – 34 seem to visit more than others age groups. The percentage of people from 18 to 24 and 25 to 34 started at about 10%. The next 8 years, they both increased significantly and hit 30%. Then, the number of adults between 18-24 took the leading position. After a fluctuate between 50% and 60%, it reached 60% in 2010. Likewise, the rate of people from 25 to 34 went up to 50% in the last year. Otherwise, after the beginning at about 4% in 1990, the percentage of inhabitants older than 44 going to the gyms levelled of at 10%. Then, it increased to more than 20% in 2010. The number of people from 35 to 44 started at 5%. After a noticeable rise by nearly 35%, this figure reached the third position of 40%.
नमूना विवरण
The chart below gives information about European people of different age groups who went to gyms once a month or more between 1990 and 2010.
21/07/2026 18:03 6.5 अंक
विषय
The chart below gives information about European people of different age groups who went to gyms once a month or more between 1990 and 2010.
शब्दों की संख्या: 180
चार्ट/ग्राफ
Essay
समग्र स्कोर
6.5±0.5
ठीक
राइटिंग मानदंड स्कोर
TA7.0
CC7.0
LR6.0
GRA7.0
सुधार के विस्तृत सुझाव देखने के लिए लेख में किसी भी हाइलाइट किए गए टेक्स्ट पर क्लिक करें।
गहन विश्लेषण
Task 1 - Academic Writing
4 उपकरण उपलब्ध
नमूना लेख - IELTS Writing Task 1
कोई नमूना लेख नहीं
Task 1 के लिए उच्च-गुणवत्ता वाला नमूना लेख विश्लेषण और बनाने के लिए नीचे दिए गए बटन पर क्लिक करें।