
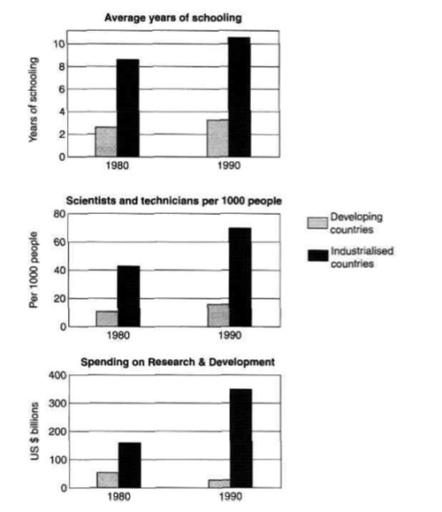
The bar charts compare the proportion of educational and scientific levels namely average years of schooling, the number of scientists and technicians per 1,000 people, and spending on research and development in developing and industrialized countries in 1980 and 1990. Overall, all values experienced an upward trend from 1980 to 1990. Besides, the levels of participation in education and science in developed countries dominated the figure for developing countries in all sectors in both years. In addition, the largest gap was funds spent on research and development between 1980 and 1990. The average year of school and the propertion of sicentists and technicians climbed in both groups and the figures for the industrialised regions was larger than those in developing regions . In particular, in industrialized countries, it lasted about 8.5 years. Then, the figure increased moderately and stood at 10.5 years in 1990, which 2 years higher than the figure for the previous decade. Meanwhile, the developing countries had shorter years of schooling compared with another. It was only accounted for more than 2 years in 1980 and lasted roughly 4 years in 1990. Howerver, the figure for industrialised countries tripled that for developing countries. Furthermore, the number of scientists and technicians in developing countries stood at about 10 people in 1980. After decade, the figure for that approximately 5 individuals higher than that figure for 10 years ago. By contrast, developd countries had a great deal of people who were scientists or technicians with above 40 in 1980 and around 70 in 1990. Despite having consider growth, the number of scientists and technicians grow more quickly than the average year of school. Moreover, the funds spending on Research and Development in the developed regions also remarkablely similar when it recorded double growth during the period with about 170 US billion in 1980 and nearby 350 US billion in 1990. Although all figures showed their increase, the funds of developing countries used for Research and Development witnessed a downward trend. The number of funds in 1980 made up roughly 55 US billion, but it was half in 1990. Therefore, the largest unbalance during the whole period was created between the figure for investment in Research and Development in industrialised countries and developing countries in 1990.
नमूना विवरण
the charts below show the levels of participation in education and science in developing and industrialized countries in 1980 and 1990
21/07/2026 18:05 6.0 अंक
विषय
the charts below show the levels of participation in education and science in developing and industrialized countries in 1980 and 1990
शब्दों की संख्या: 376
चार्ट/ग्राफ
Essay
समग्र स्कोर
6.0±0.5
ठीक
राइटिंग मानदंड स्कोर
TA6.0
CC6.0
LR6.0
GRA6.0
सुधार के विस्तृत सुझाव देखने के लिए लेख में किसी भी हाइलाइट किए गए टेक्स्ट पर क्लिक करें।
गहन विश्लेषण
Task 1 - Academic Writing
4 उपकरण उपलब्ध
नमूना लेख - IELTS Writing Task 1
कोई नमूना लेख नहीं
Task 1 के लिए उच्च-गुणवत्ता वाला नमूना लेख विश्लेषण और बनाने के लिए नीचे दिए गए बटन पर क्लिक करें।