
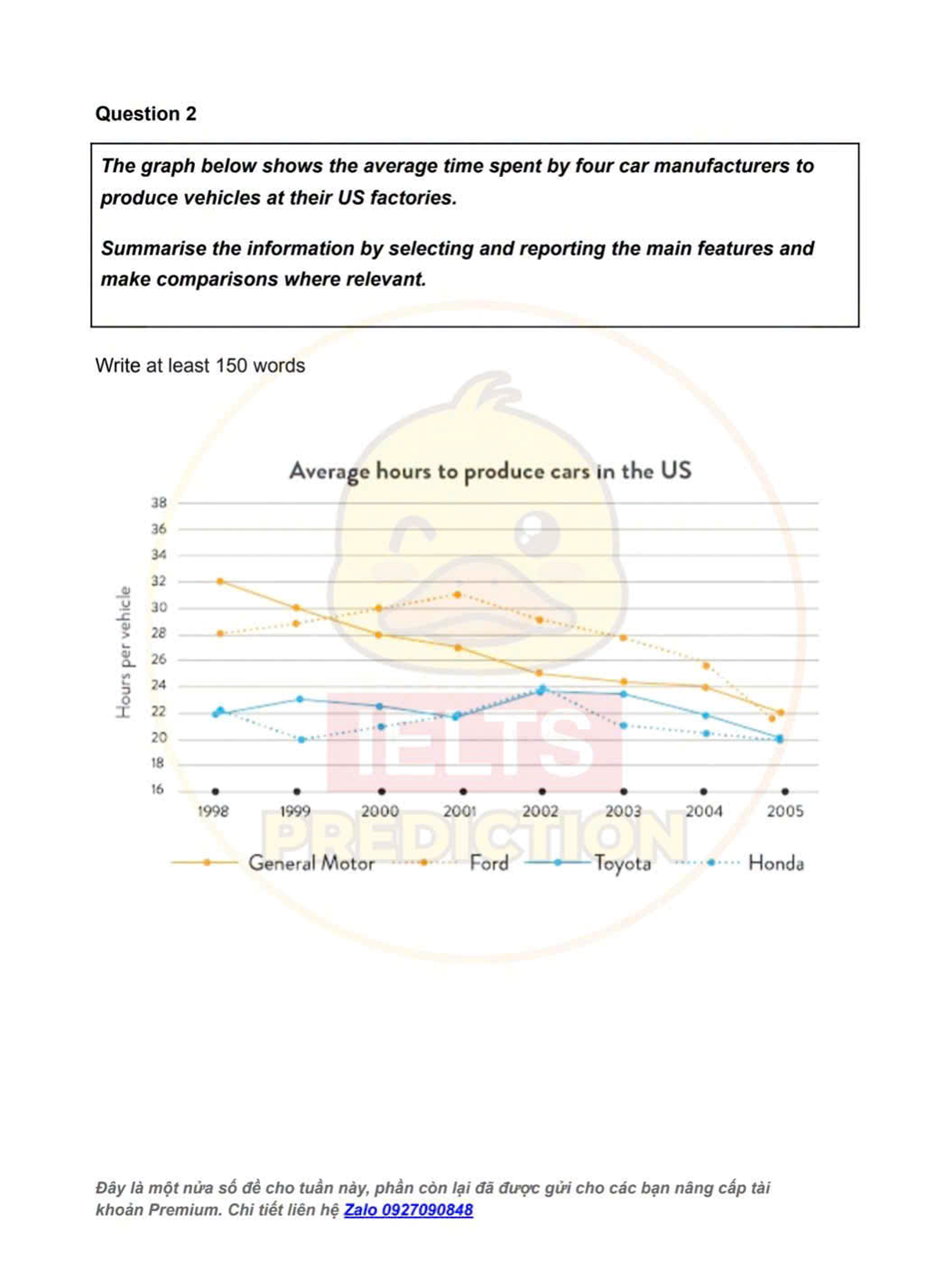
The graph illustrates the average time spent by four car brands, namely General Motor, Ford, Toyota and Honda to manufacture vehicles in the US between 1998 and 2005. Overall, the average time spent to create a vehicle reduced sigfinicantly regardless of manufacturers. Notably, the hours to produce per vehicle made by General Motor was the longest despite some breakthroughs by others. By 1998, General Motor and Ford had become the tops of the list. The firgure for General Motor was 32 hours per vehicle while the average time to manufacture a Ford vehicle accounted for roughly 28 hours. Meanwhile, Ford’s figure overpassed General Motor in the mid-2000s, continued to be the longest over the period. Notably, the average time to produce a Ford vehicle reached its peak in 2001, with approximately 31 hours. After that, it dropped dramatically in the next 4 years, ultimately stopped at around 22 hours, while the figure for General Motor saw a rapid development in their time spent, with only 22 hours, compared to the initiall figure. Moving onto the figures of the 2 last brands, the average time spent to create per vehicle made by Toyota and Honda started at roughly 22 hours. After 1 year, while the figure for Toyota edged up to around 23 hours, Honda witnessed a significant decrease, with only 20 hours. Notably, these 2 figures reached almost the same portion in 2001 and 2002, which was the longest time spent by 2 brands, with surprisingly 24 hours. After that, they began to drop and finally stopped at around 20 hours by 2005.
Sample Detail
The graph below shows the average time spent by four manufacturers to produce vehicles at their US factories. Summarise the information by selecting and repairing the main features and make camparisions where relevant.
21/07/2026 18:16 6.5 points
Topic
The graph below shows the average time spent by four manufacturers to produce vehicles at their US factories. Summarise the information by selecting and repairing the main features and make camparisions where relevant.
Word count: 263
Chart/Graph
Essay
Overall Scores
6.5±0.5
Fair
Writing Criteria Scores
TA6.0
CC7.0
LR6.0
GRA7.0
Click on any highlighted text in the essay to view detailed suggestions for improvement.
Deep Analysis
Task 1 - Academic Writing
4 tools available
Sample Essay - IELTS Writing Task 1
No sample essay
Click the button below to analyze and generate a high-quality sample essay for Task 1.