
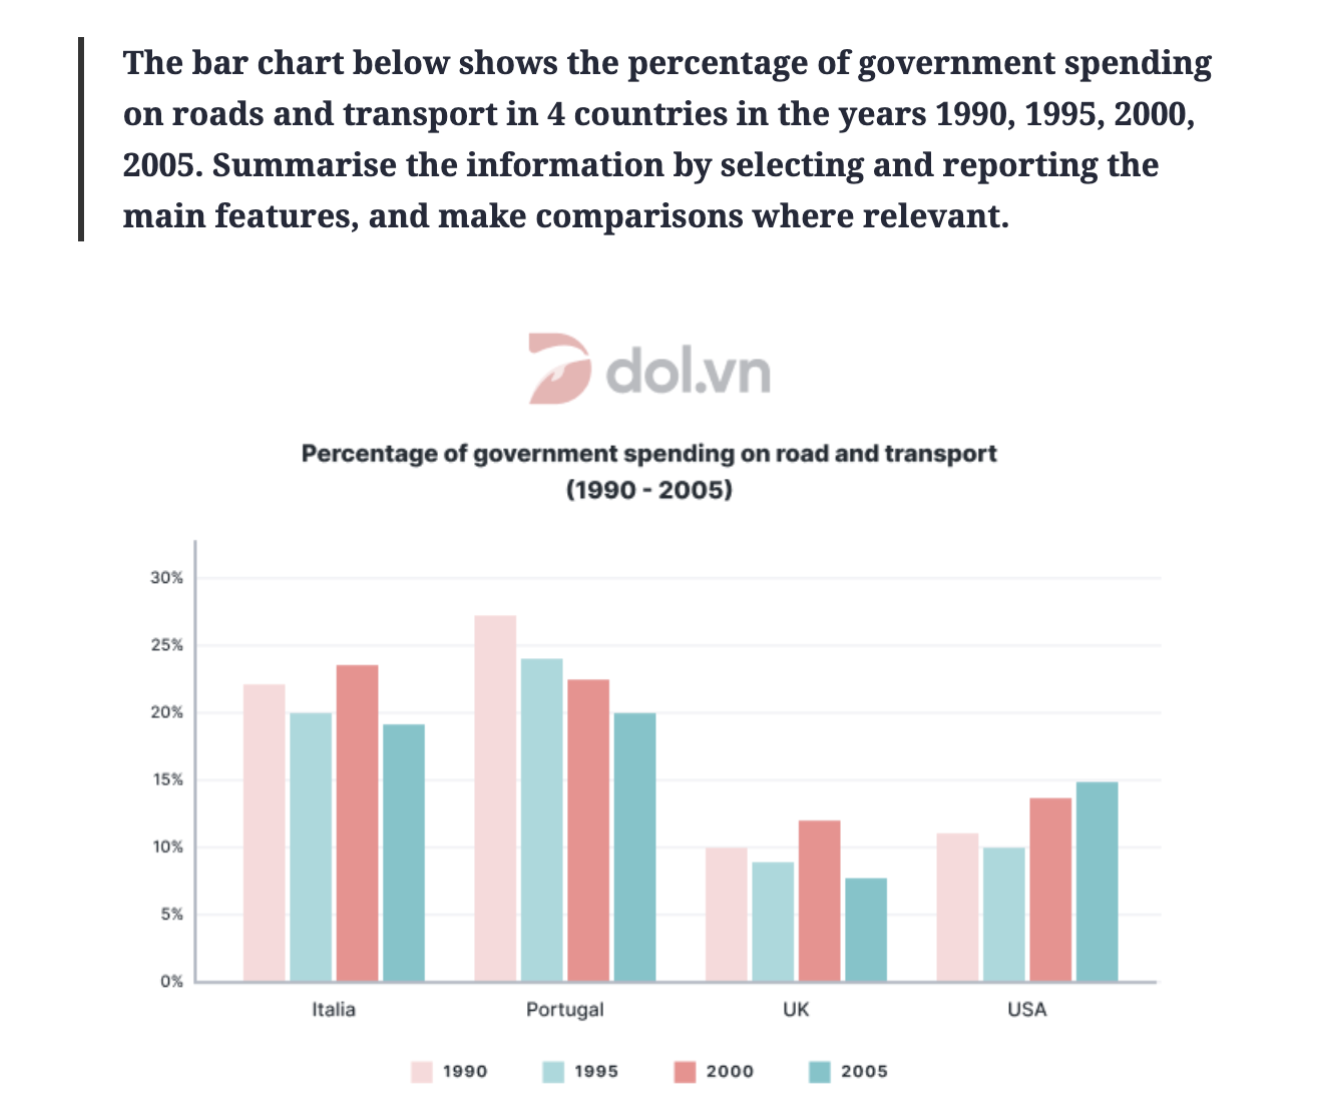
The bar chart illustrates the percentage of government expenditure on roads and transport in four countries from 1990 to 2005. An examination of data reveals a clear divergence in spending trends across the roads and transport over the surveyed period. While the uptake of the USA experienced substantial growth, the proportion of fundings in Italy and the UK saw a volatility. The percentage of government expenditure in Portugal, meanwhile, secured the leading position in the first year of the period. Regarding the expense on roads and transportations in Portugal, it took the highest share at roughly 27% in 1990, whereas the percentage of government spending experienced a steady decline to 20% by 2005. There was a moderate fluctuation in the rate of funding in India, reaching a peak to 24% in 2000. Conversely, the expenditure’s percentage rebounded to about 19% in the final year of the period. In terms of the UK’s spending, by 1995, a slight decrease was witnessed at 9%, while there was a marginal rise to 12% in 2000, and it represented a plummet to 8% by 2005. Additionally, there was 11% of the percentage of government expenditure at the beginning, in 1990. A marginal decrease was witnessed to approximately 10% in 1995. By contrast, the proportion of roads and transport’ funding soared to 15% in the final year of the period.
नमूना विवरण
The bar chart below shows the percentage of government spending on roads and transport in 4 countries in the years 1990, 1995, 2000, 2005. Summarise the information by selecting and reporting the main features, and make comparisons where relevant.
21/07/2026 18:24 6.5 अंक
विषय
The bar chart below shows the percentage of government spending on roads and transport in 4 countries in the years 1990, 1995, 2000, 2005. Summarise the information by selecting and reporting the main features, and make comparisons where relevant.
शब्दों की संख्या: 225
चार्ट/ग्राफ
Essay
समग्र स्कोर
6.5±0.5
ठीक
राइटिंग मानदंड स्कोर
TA6.0
CC7.0
LR6.0
GRA7.0
सुधार के विस्तृत सुझाव देखने के लिए लेख में किसी भी हाइलाइट किए गए टेक्स्ट पर क्लिक करें।
गहन विश्लेषण
Task 1 - Academic Writing
4 उपकरण उपलब्ध
नमूना लेख - IELTS Writing Task 1
कोई नमूना लेख नहीं
Task 1 के लिए उच्च-गुणवत्ता वाला नमूना लेख विश्लेषण और बनाने के लिए नीचे दिए गए बटन पर क्लिक करें।