
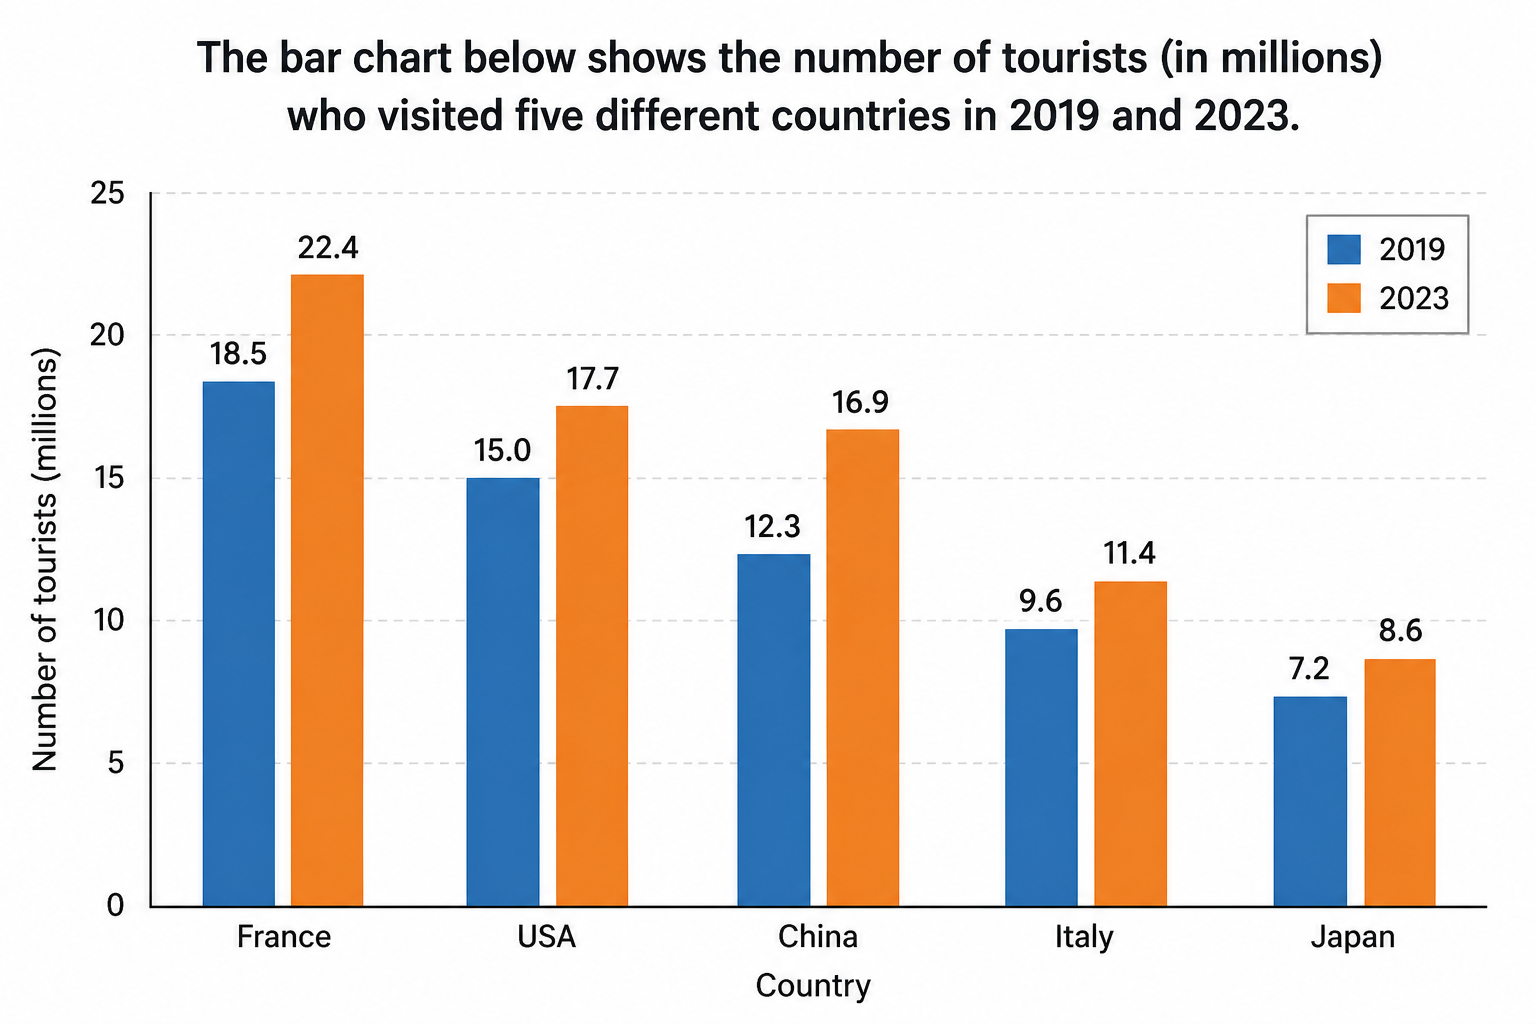
The bar chart illustrates the quantity of tourists that travelled five countries including France, USA, China, Italy and Japan in two years, 2019 and 2023. Overall, France had the highest number of visitors in both two years, whereas Japan recorded the lowest figure. It is noticeable that the percentages increased in 2023 compares with the past. Looking first at the France with higher figures, France ranked first, with 18.5 millions tourists in 2019 and 22.4 millions traverlers in 2023. China followed with 15.0 millions visitors in 2019 and 17.7 millions in 2023, which was 3.5 and 4.7 figure points lower than France's number. The number of China traverllers were about 12.3 millions and 16.9 millions in 2019 and 2023. Turning to the remaining countries, Italy recorded a considerably lower figure of 9.6 millions tourists in 2019 and 2023 was noted that its number was 11.4 millions. By comparison, Japan had the smallest figures in both two years, with 7.2 and 8.6 millions in 2019 and 2023. Overall, there was a significant gap between the number of visitors in France and Japan in two different years.
Sample Detail
The bar chart below shows the number of tourists (in millions) who visited five different countries in 2019 and 2023.
21/07/2026 18:55 5.0 points
Topic
The bar chart below shows the number of tourists (in millions) who visited five different countries in 2019 and 2023.
Word count: 185
Chart/Graph
Essay
Overall Scores
5.0±0.5
Basic
Writing Criteria Scores
TA5.0
CC6.0
LR5.0
GRA5.0
Click on any highlighted text in the essay to view detailed suggestions for improvement.
Deep Analysis
Task 1 - Academic Writing
4 tools available
Sample Essay - IELTS Writing Task 1
No sample essay
Click the button below to analyze and generate a high-quality sample essay for Task 1.