
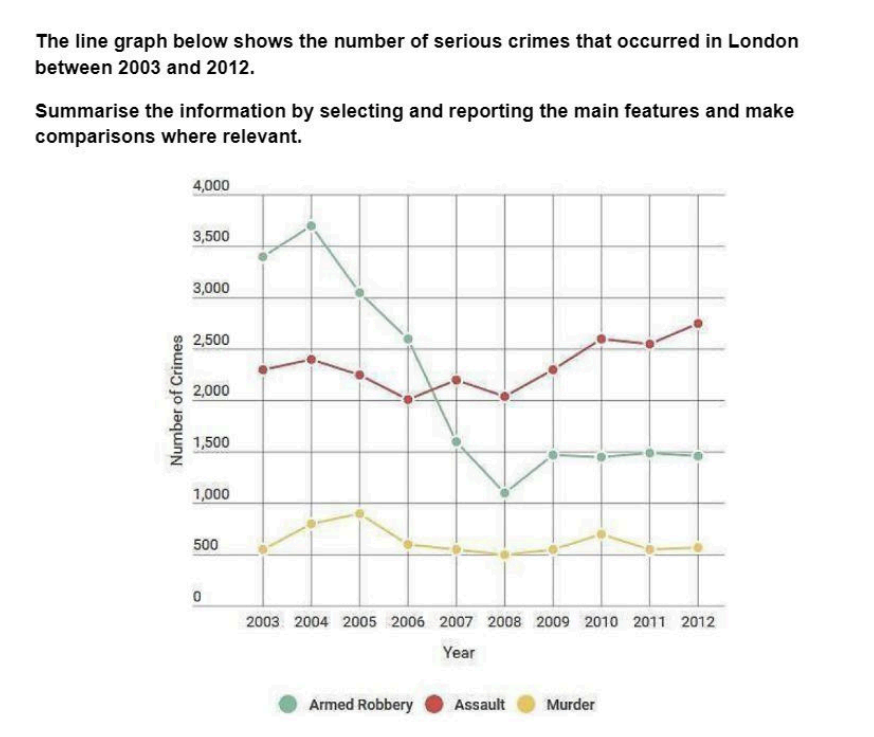
The data displays the number of lawbreaking that was committed in London from 2003 to 2012. Overall, the figure for armed robberies dropped significantly and remained steadily towards the end of the period. While the quantity of murders committed remained relatively stable, the number of assaults increased throughout the given period. The occurrence of armed robbery slightly increased from 2003 to 2004, reaching its peak at approximately 3700 cases. This figure then experienced a massive drop over the next 4 years to just over 1000 in 2008, before rising to exactly 1500 in a year later and remained around the same level towards the end of the period. In contrast, the quantity of assaults started off at around 2400 in 2003 and fluctuated to approximately 2000 in 2008. This number increased gradually to just over 2500 in 2010 and ended the period at about 2800. On the other hand, the number of murder cases reached its highest point at around 900 in 2005, before decreasing to approximately 600 a year later and remained at a value between 500 to around 700 towards 2012.
নমুনা বিস্তারিত
The line graph below shows the number of serious crimes that occured in London between 2003 and 2012
21/07/2026 22:11 6.0 স্কোর
টপিক বা বিষয়
The line graph below shows the number of serious crimes that occured in London between 2003 and 2012
শব্দ সংখ্যা: 183
চার্ট/গ্রাফ
Essay
সামগ্রিক স্কোর
6.0±0.5
মোটামুটি
রাইটিং মানদণ্ড স্কোর
TA6.0
CC7.0
LR6.0
GRA6.0
উন্নতির জন্য বিস্তারিত পরামর্শ দেখতে প্রবন্ধের হাইলাইট করা যেকোনো লেখায় ক্লিক করুন।
গভীর বিশ্লেষণ
Task 1 - Academic Writing
4 tools available
নমুনা রচনা - IELTS Writing Task 1
কোনো নমুনা রচনা নেই
টাস্ক ১-এর জন্য উচ্চমানের নমুনা রচনা বিশ্লেষণ এবং তৈরি করতে নিচের বাটনে ক্লিক করুন।