
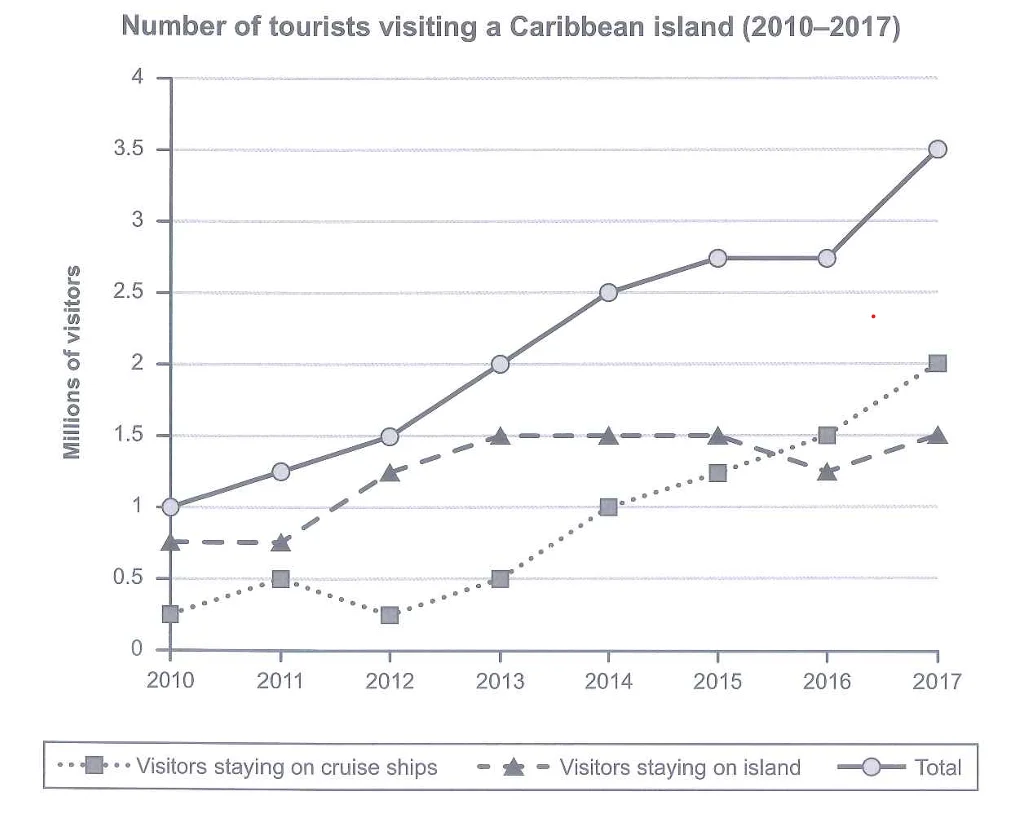
The provided chart illustrates how many people paid a visit to a particular Caribbean island from 2010 through 2017. Overall, the total number of visitors to the island experienced an upward during the period while those categorized by those staying on cruise ships which rosed significantly during the period and those staying on the island which underwent a more modest growth. Between 2010 and 2017, the total number tourists to a Caribbean island experienced a significant increase. In the first two years, it rose steadily from 1 to 1.5 million people before growing dramatically by 1.25 million people in the next four years and finally peaked at 3.5 million. Over the period, the number of tourists taking the vacation on cruise ships saw a more significant growth than the figure for tourists enjoying the trip on the island, starting at 0.25 million people in 2010 and then rose steadily until 2017 to reach 2 million visitors. Meanwhile, the number of visitors staying on island began at 0.75 in 2010 and just rose from 0.75 to 1.5 million people between 2011 and 2013 but then remained relatively stable until the end of the period.
รายละเอียดตัวอย่าง
The graph below shows the number of tourists visiting a particular Caribbean island between 2010 and 2017. Summarise the information by selecting and reporting the main features, and make comparisons where relevant.
22/07/2026 00:40 6.5 คะแนน
หัวข้อ
The graph below shows the number of tourists visiting a particular Caribbean island between 2010 and 2017. Summarise the information by selecting and reporting the main features, and make comparisons where relevant.
จำนวนคำ: 193
แผนภูมิ/กราฟ
Essay
คะแนนรวม
6.5±0.5
ดีพอใช้
คะแนนเกณฑ์การเขียน
TA7.0
CC7.0
LR6.0
GRA6.0
คลิกข้อความที่ไฮไลต์ในเรียงความเพื่อดูคำแนะนำรายละเอียดเพื่อพัฒนา
การวิเคราะห์เชิงลึก
Task 1 - Academic Writing
4 tools available
บทความตัวอย่าง - IELTS Writing Task 1
ยังไม่มีบทความตัวอย่าง
กดปุ่มด้านล่างเพื่อวิเคราะห์และสร้างบทความตัวอย่างคุณภาพสูงสำหรับ Task 1