
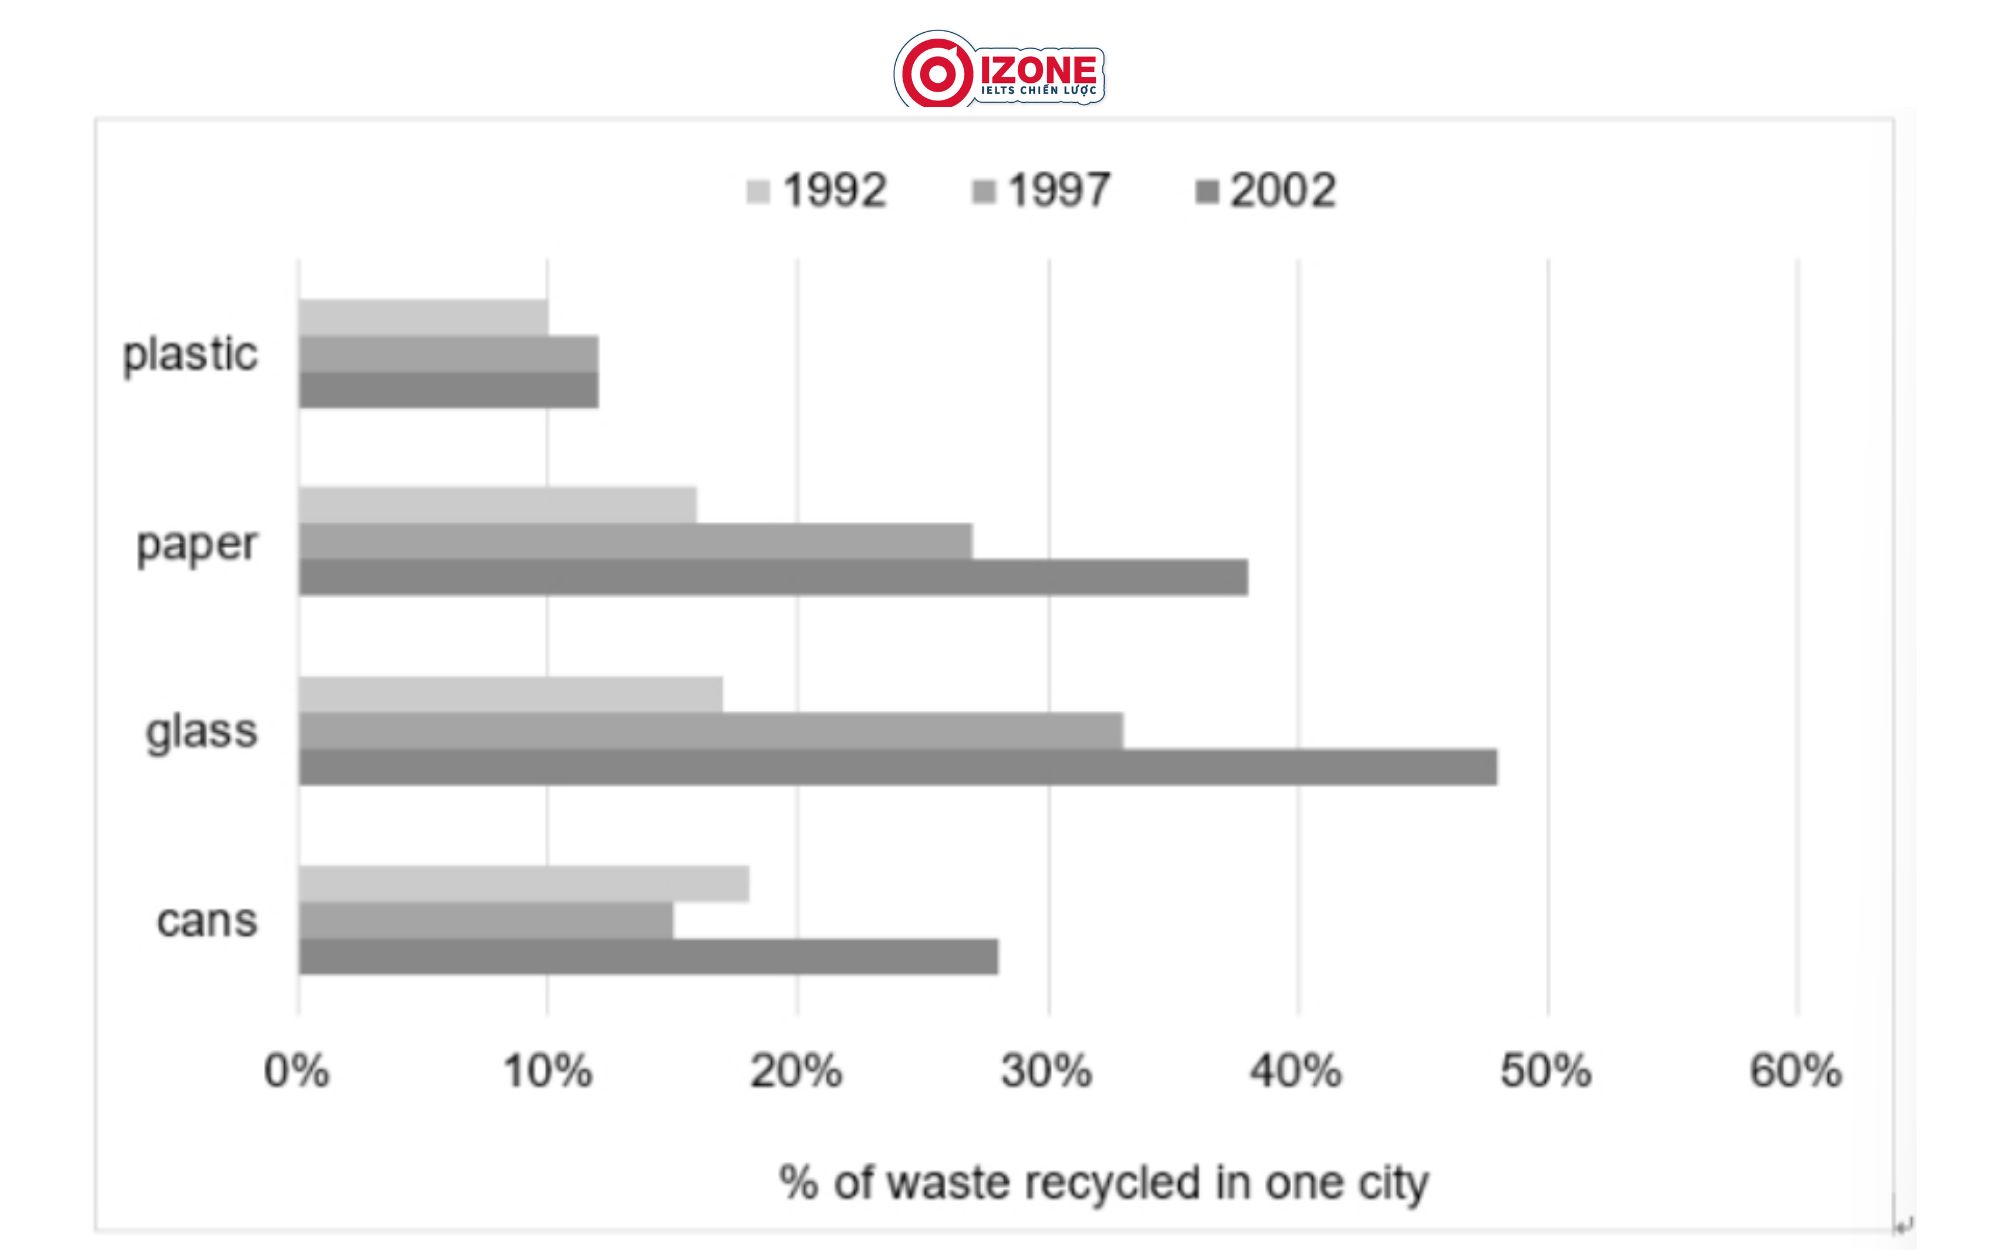
The bar chart illustrates the proportion of four types of household waste including plastic, paper, glass and cans that underwent a recycle process in a particular city every five years from 1992 to 2002. Overall, recycled waste of all four types increased throughout. It is also notable that glass was the most recycled waste in the whole period except for the first year while plastic remained stable as the least likely to be renewed. In regard to those that presented the most pronounced changes, glass commenced at 16% while paper trailed behind at 15%. The former then doubled to 32% in 1997 and continued to rise, reaching a peak of 48% in 2002 and becoming the predominant figure in the whole chart. A prevalent increasing trajectory was seen in paper, whereas its percentage grew to 26% and 38% in 1997 and 2002 respectively, it was the final year in which it became the second highest. Turning to the remaining household wastes, the proportion of cans receiving recycling showed the only decline in the whole period shown, with this number dropping from 18% to 15% from 1992 to 1997. Despite being the only decreasing type in the first period, cans subsequently bounced back to 28% , thereby securing its third place. Finally, plastic witnessed an increase of just 2% from 10% to 12% in 1997 and leveling off for the rest of the period.
รายละเอียดตัวอย่าง
The chart below shows the percentages of different types of household waste that were recycled in one city between 1992 and 2002.
22/07/2026 01:43 6.5 คะแนน
หัวข้อ
The chart below shows the percentages of different types of household waste that were recycled in one city between 1992 and 2002.
จำนวนคำ: 233
แผนภูมิ/กราฟ
Essay
คะแนนรวม
6.5±0.5
ดีพอใช้
คะแนนเกณฑ์การเขียน
TA6.0
CC7.0
LR7.0
GRA7.0
คลิกข้อความที่ไฮไลต์ในเรียงความเพื่อดูคำแนะนำรายละเอียดเพื่อพัฒนา
การวิเคราะห์เชิงลึก
Task 1 - Academic Writing
4 tools available
บทความตัวอย่าง - IELTS Writing Task 1
ยังไม่มีบทความตัวอย่าง
กดปุ่มด้านล่างเพื่อวิเคราะห์และสร้างบทความตัวอย่างคุณภาพสูงสำหรับ Task 1