
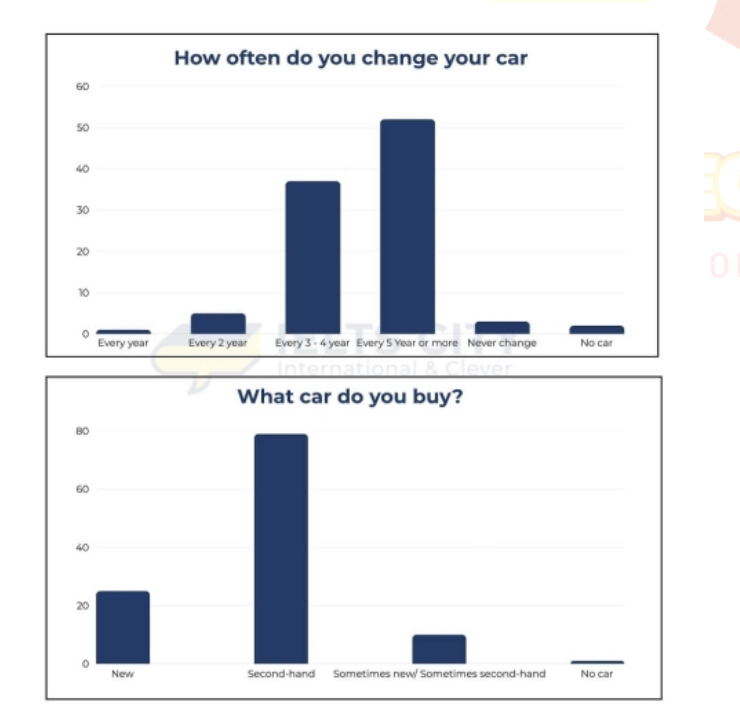
The two charts depicts the habits of changing their own car and which types of car they choose to buy in a European nation in 2009. Overall, people in European preferred second-hand as the best choice while the highest proportion of the frequency to change another car is every 5 year or more. Moreover, no car in two charts took up the considerable minority of percentage. Relating to how often they change their own car, every 5 years or more which secure the top position ( 51%) outnumbered 12% than every 3-4 years. Continually, 4 groups ( every year, every 2 year, never change and no car) contrasted starkly with a very small percentage ( under 6%) in charts. According to the kinds of car they afford, second-hand dominating the sector with around 80% was significantly ahead of that for other types. New ones just was one-third percentage of secondhand. However, it was twice as much as sometimes new or sometimes second-hand. While no car was the most minor percentages with just nearly 0%.
Sample Detail
The bar charts display the results from a 2009 survey regarding people's automobile in a European country.
22/07/2026 01:44 6.0 points
Topic
The bar charts display the results from a 2009 survey regarding people's automobile in a European country.
Word count: 174
Chart/Graph
Essay
Overall Scores
6.0±0.5
Fair
Writing Criteria Scores
TA6.0
CC6.0
LR6.0
GRA6.0
Click on any highlighted text in the essay to view detailed suggestions for improvement.
Deep Analysis
Task 1 - Academic Writing
4 tools available
Sample Essay - IELTS Writing Task 1
No sample essay
Click the button below to analyze and generate a high-quality sample essay for Task 1.