
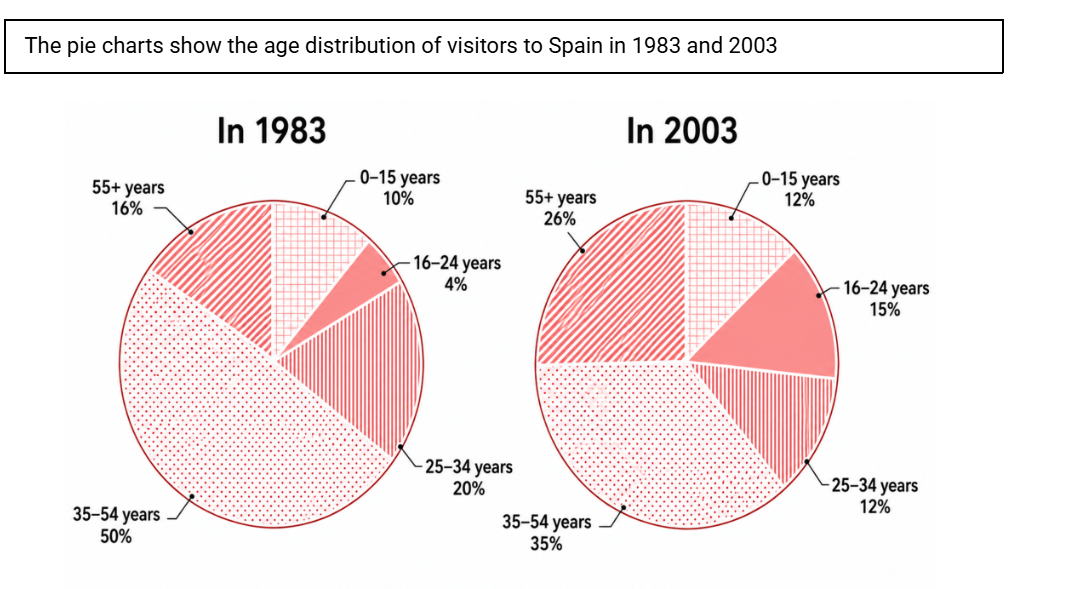
The pie charts delineate how many tourists of different age groups visited Spain in 1983 and 2003. Overall, the visits to Spain saw increases for most of the age brackets, though extents of growth varied, whereas the 25-34 and 35-54 age cohorts declined substantially. Although the figure for people aged 35-54 dropped remarkably, it still occupied the largest portion of the statistics. Regarding age brackets which observed decreases, the majority of Spain’s visitors belonged to the 25-34 and 35-54 age groups in 1983. The figure for the older age cohort took up a half of the total visits, distantly followed by 20% of the proportion of people aged 25-34. In 2003, the latter considerably dropped to 12%, while the proportion of 35-54-year-olds witnessed a more significant decrease to 35%. Despite this downward trend, the 35-54 age bracket still maintained the largest group of visitors. By stark contrast, an increasing number of tourists to Spain were recorded in other age cohorts. In 1983, Spain welcomed 4% and 16% visitors who were aged 16-24 and 55 or more. Later in 2003, the figure for both age brackets rose considerably, to 15% and 26% respectively, making the oldest age group rank second in the total visits. Meanwhile, the youngest age group (0-15 years old) started at 10% in 1983 and only saw a minimal increase of 2% in 2003, making them the lowest number of visitors.
नमूना विवरण
The pie charts show the age distribution of visitors to Spain in 1983 and 2003.
22/07/2026 01:49 7.0 अंक
विषय
The pie charts show the age distribution of visitors to Spain in 1983 and 2003.
शब्दों की संख्या: 233
चार्ट/ग्राफ
Essay
समग्र स्कोर
7.0±0.5
अच्छा
राइटिंग मानदंड स्कोर
TA7.0
CC7.0
LR7.0
GRA7.0
सुधार के विस्तृत सुझाव देखने के लिए लेख में किसी भी हाइलाइट किए गए टेक्स्ट पर क्लिक करें।
गहन विश्लेषण
Task 1 - Academic Writing
4 उपकरण उपलब्ध
नमूना लेख - IELTS Writing Task 1
कोई नमूना लेख नहीं
Task 1 के लिए उच्च-गुणवत्ता वाला नमूना लेख विश्लेषण और बनाने के लिए नीचे दिए गए बटन पर क्लिक करें।