
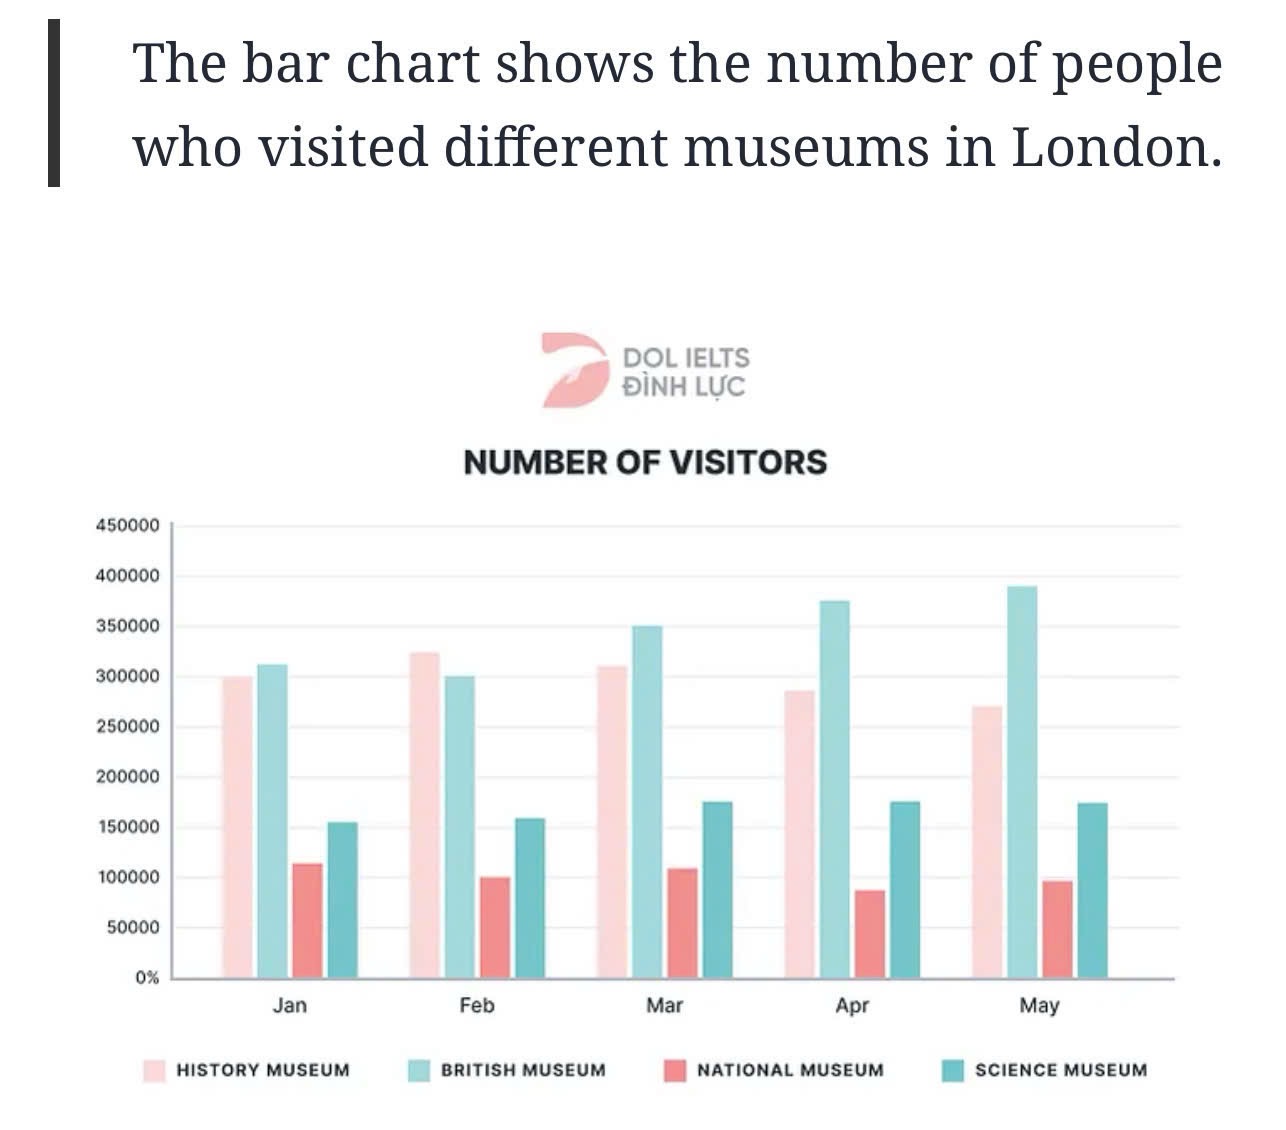
The chart illustrates how many people visiting four different London’s museums. Overall, what is notable from the chart is that history and national museums witnessed a downward trend, whereas British and science museums exhibited a contrasting pattern. In addition, British museum held the top spot during the entire surveyed period. At the start of the period, with 310000 visitors, British museum emerged as the leading museums, closely followed by history museum, with 300000 visitors. Far below was science museum, with approximately 150000 people visited it. At the bottom of the list was national museum, as its figure stood at 110000 visitors. Thereafter, February registered a modest decrease to 300000 people visited British museum, before a sharp rise to 390000 people was recorded in May. Conversely, history museum saw a considerable growth to 320000 visitors in February, followed by a noticeable fall to 275000 in May. Meanwhile, the number of people who visited science museum increased moderately to 170000 on March, and then experienced no change until May. There was a fluctuation around 90000 visitors of national museum was witnessed between January and May.
รายละเอียดตัวอย่าง
The bar chart below shows the number of people who visited different museums in london.
22/07/2026 01:59 6.5 คะแนน
หัวข้อ
The bar chart below shows the number of people who visited different museums in london.
จำนวนคำ: 183
แผนภูมิ/กราฟ
Essay
คะแนนรวม
6.5±0.5
ดีพอใช้
คะแนนเกณฑ์การเขียน
TA7.0
CC7.0
LR6.0
GRA6.0
คลิกข้อความที่ไฮไลต์ในเรียงความเพื่อดูคำแนะนำรายละเอียดเพื่อพัฒนา
การวิเคราะห์เชิงลึก
Task 1 - Academic Writing
4 tools available
บทความตัวอย่าง - IELTS Writing Task 1
ยังไม่มีบทความตัวอย่าง
กดปุ่มด้านล่างเพื่อวิเคราะห์และสร้างบทความตัวอย่างคุณภาพสูงสำหรับ Task 1