
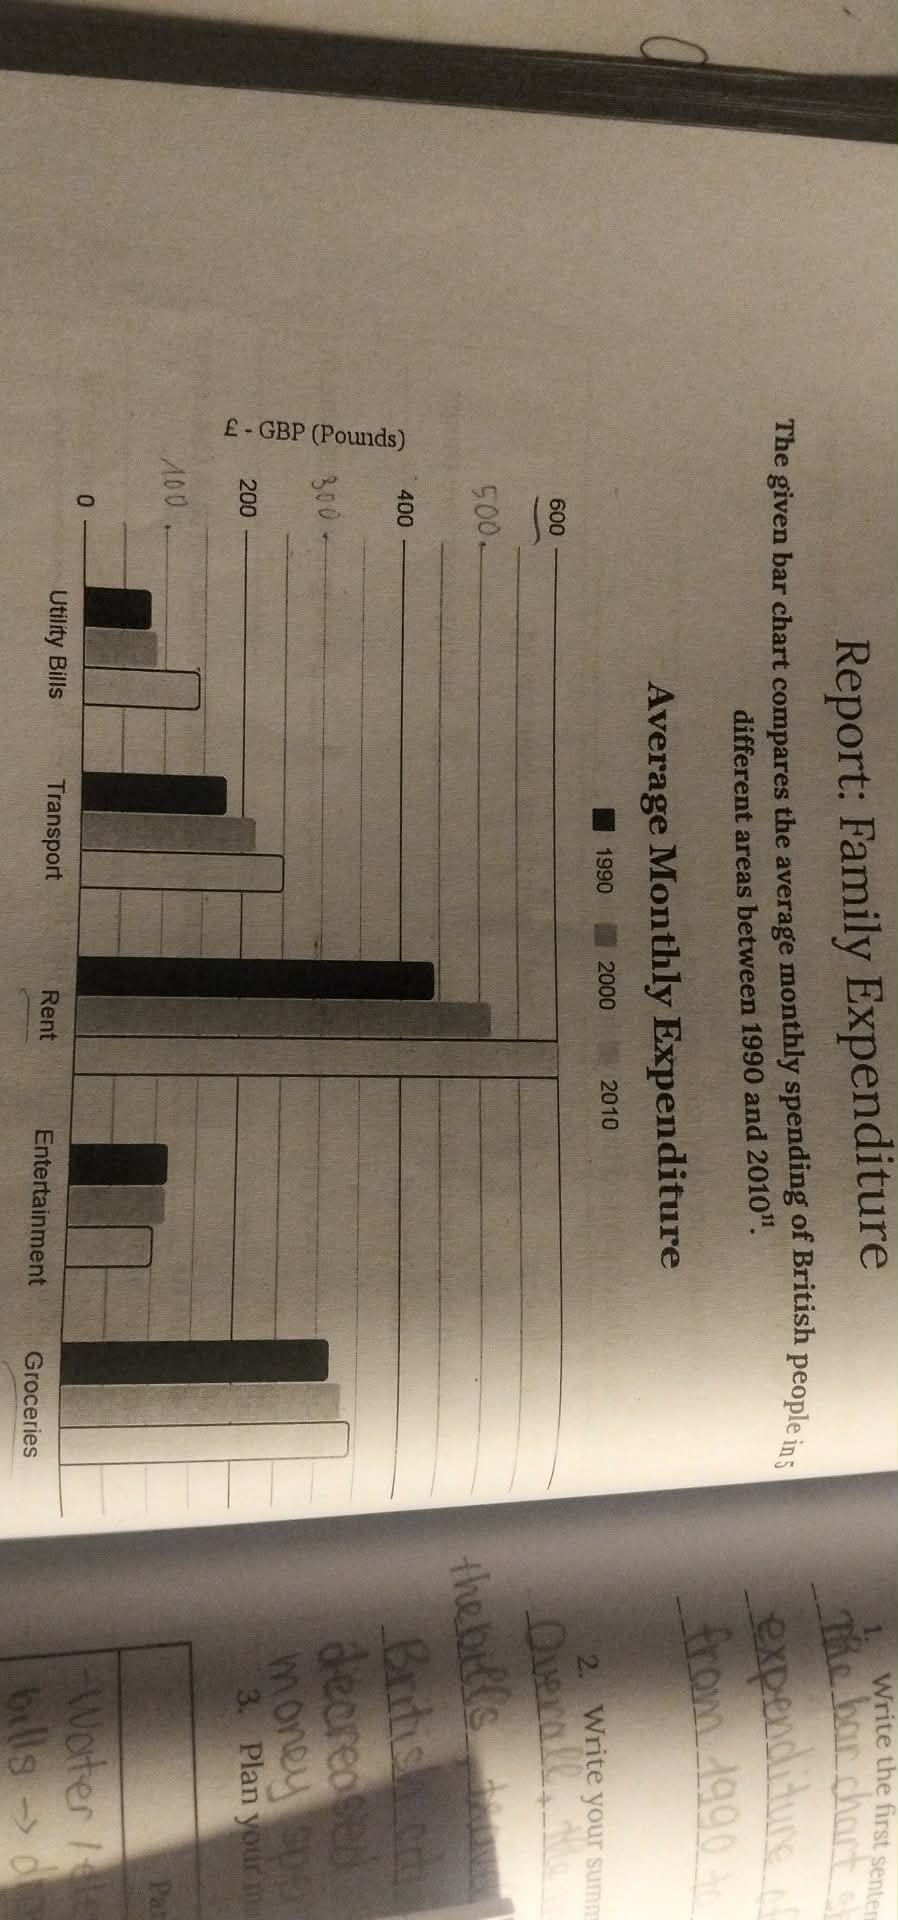
The bar chart depicts the variations in average monthly outgoings of British citizens among five categories between 1990 and 2010. Overall, while the amount that British people allocated to household utility costs, travelling, food shopping and rent saw an upward trend, expenditure on entertainment experienced a steady decrease. It is noteworthy that the average spent per month on paying the rent remained the highest throughout the period. Regarding the increasing trends, the amount that Britons spent on utility services witnessed a remarkable surge from approximately 80 pounds to around 130 pounds from 1990 to 2010. Additionally, there was a moderate growth in the sum on transportation from around 180 pounds to 250 pounds, making it the second highest outlay category. In 1990, rent expenditure stood at approximately 400 pounds, which then soared considerably over the next twenty years to peak at 580 pounds in 2010, accounting for the largest proportion of spending. Furthermore, the figure for groceries experienced a mild growth from around 220 pounds to roughly 250 pounds in the same period. Concerning the downward trend, there was a slight decrease in the average monthly allocation to entertainment, which dropped from around 100 pounds to approximately 80 pounds which represented the lowest expenditure.
Detail Sampel
The given bar chart compares the average monthly spending of British people in 5 different areas between 1990 and 2010
22/07/2026 02:01 8.0 skor
Topik
The given bar chart compares the average monthly spending of British people in 5 different areas between 1990 and 2010
Jumlah kata: 204
Grafik/Diagram
Essay
Skor Keseluruhan
8.0±0.5
Sangat baik
Skor Kriteria Writing
TA8.0
CC8.0
LR8.0
GRA8.0
Klik teks yang ditandai di esai untuk melihat saran detail untuk peningkatan.
Analisis mendalam
Task 1 - Academic Writing
4 tools available
Esai contoh - IELTS Writing Task 1
Belum ada esai contoh
Silakan klik tombol di bawah untuk menganalisis dan membuat esai contoh berkualitas tinggi untuk Task 1.