
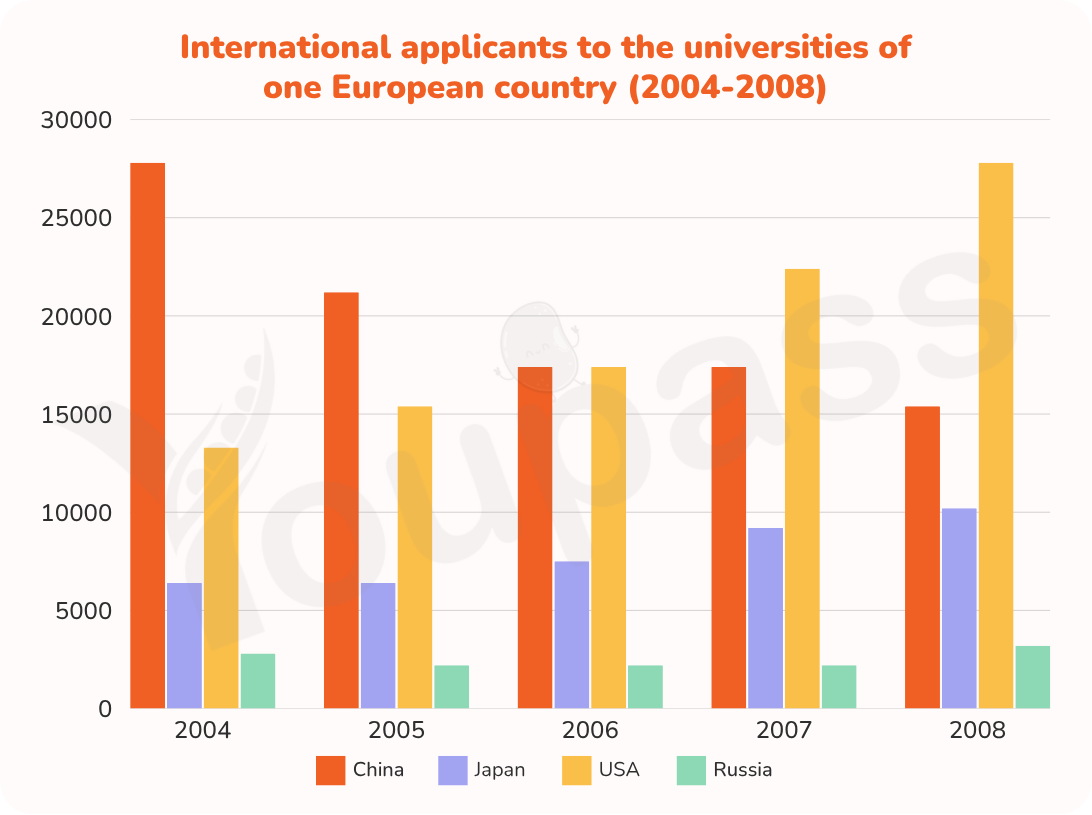
The given chart compares the number of overseas students from 4 countries registering in European universities, in a five-year period from 2004. Overall, it is noticeable that while China held the first position of top applicants in the former phase, students from America secured this top spot in the latter years, since 2006. Moreover, Russian learners applied for the fewest throughout the period, and these figures experienced less fluctuation compared to the other two figures. Regarding the first 3 years of the period, China dominated in the number of students seeking entries to European universities, at approximately 27000 applicants. However, this number declined significantly in the next 2 years, with only about 17000 applicants left. Although it still held to top position, this spot was then shared with the USA. On the contrary, USA applicants saw a great rise, from over 13000 to 17000 after 3 years, thereby securing the to position. At the same period, while Japan saw a small increase from over 6000 applicants in 2004 to 7000 in 2006, Russia saw different trend of a minor decline, dropping from over 2500 students to 2000. Considering the latter phase, while the figure for China stayed stable in the next year, it dropped to over 15000 applicants in 2008, whereas USA saw a dramatic rise to over 27000 applicants in the same year. The number of Japanese students also increased stably to 10000 in the latter period, while Russia rose the slightest of hundreds of students.
Sample Detail
The chart below shows the number of students from four different countries applying to European universities. Summarise the information by selecting and reporting the main features, and make comparisons where relevant.
22/07/2026 02:17 7.0 points
Topic
The chart below shows the number of students from four different countries applying to European universities. Summarise the information by selecting and reporting the main features, and make comparisons where relevant.
Word count: 247
Chart/Graph
Essay
Overall Scores
7.0±0.5
Good
Writing Criteria Scores
TA7.0
CC8.0
LR7.0
GRA7.0
Click on any highlighted text in the essay to view detailed suggestions for improvement.
Deep Analysis
Task 1 - Academic Writing
4 tools available
Sample Essay - IELTS Writing Task 1
No sample essay
Click the button below to analyze and generate a high-quality sample essay for Task 1.