
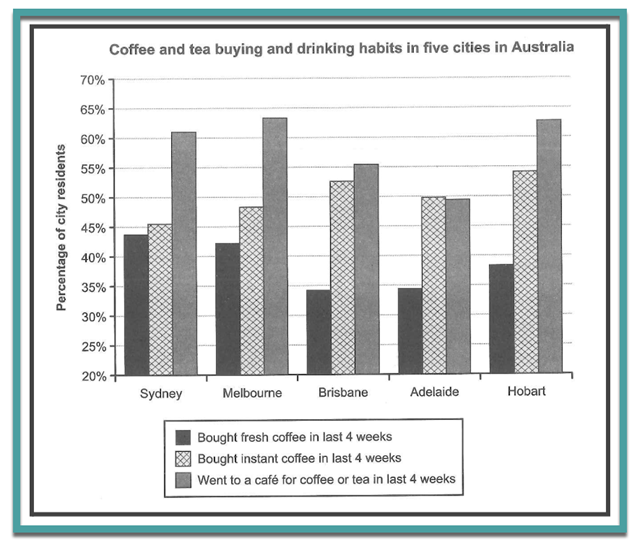
The provided bar chart illustrates the percentages of residents who bought fresh coffee, bought instant coffee, visit a café for coffee or tea across five cities in Australia during the previous 4 weeks. Overall, it is noticeable that, visiting a café for coffee or tea consistently recorded higher figures than the other activities across almost all cities, with Adelaide standing out as the sole exception in which buying instant coffee exceeded marginally going to a café for coffee or tea. Notably, buying fresh coffee was the least popular activity across all cities. Regarding the visiting a café for coffee or tea, Melbourne reached a peak of almost 64%, closely followed by Horbart and Sydney, with a share of roughly 63% and just over 60%, respectively. At the end of the spectrum, Brisbane and Adelaide brought up the rear, with the former standing at approximately 55% and the latter amounting to almost 50%. Turning to the buying fresh instant coffee, Hobart topped the ranking, which the proportion represented nearly 55%, compared to about 53% and 50% in Brisbane and Adelaide, in the order given. The figure for Melbourne and Sydney recorded the lowest figure, at nearly 48% and 45%, respectively. Regarding the buying fresh coffee, Sydney was in the leading position, accounting for around 44%, compared to 42% in Melbourne. Coming in the third place was Hobart, which its percentage constituted about 38%. The figure for two remaining cities were remarkably similar, with its share comprising almost 30% in both cities.
नमूना विवरण
The bar chart shows the coffee and tea buying and drinking habits in five cities in Australia (Sydney, Melbourne, Brisbane, Adelaide, and Hobart).Summarize the information by selecting and reporting the main features, and make comparisons where relevant.
22/07/2026 02:20 6.5 अंक
विषय
The bar chart shows the coffee and tea buying and drinking habits in five cities in Australia (Sydney, Melbourne, Brisbane, Adelaide, and Hobart).Summarize the information by selecting and reporting the main features, and make comparisons where relevant.
शब्दों की संख्या: 250
चार्ट/ग्राफ
Essay
समग्र स्कोर
6.5±0.5
ठीक
राइटिंग मानदंड स्कोर
TA7.0
CC7.0
LR6.0
GRA7.0
सुधार के विस्तृत सुझाव देखने के लिए लेख में किसी भी हाइलाइट किए गए टेक्स्ट पर क्लिक करें।
गहन विश्लेषण
Task 1 - Academic Writing
4 उपकरण उपलब्ध
नमूना लेख - IELTS Writing Task 1
कोई नमूना लेख नहीं
Task 1 के लिए उच्च-गुणवत्ता वाला नमूना लेख विश्लेषण और बनाने के लिए नीचे दिए गए बटन पर क्लिक करें।