
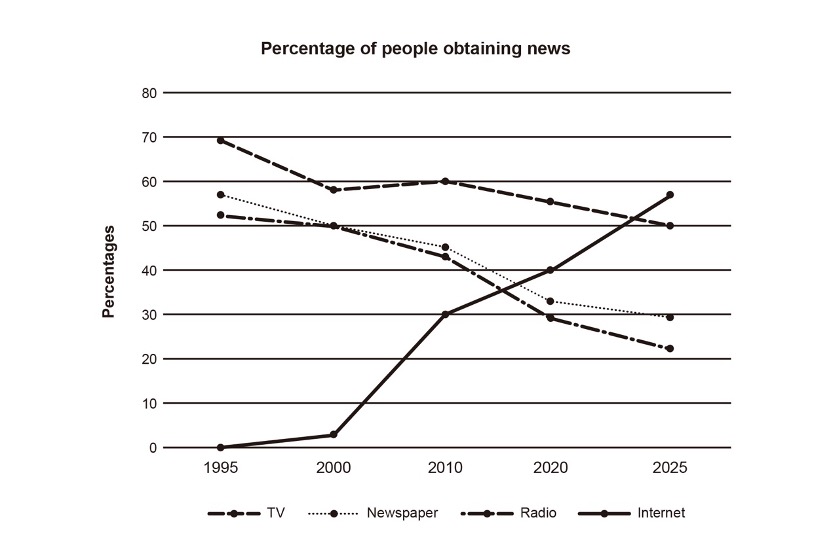
The line graph illustrates the percentage of people accessing news from four sources from 1995 and projection to 2025. Overall, only the percentage of people obtaining news from internet showed an overall upward trend. Other three sources of accessing news experienced an overall an opposite trend. The proportion for people obtaining news from internet increased slightly from 0% in 1995 to 3% in 2000, and then experienced the most significant growth to 40% in 2020. In next five years period, it will grow to 58% in 2025. By contrast, the percentage of people obtaining news from TV showed an overall downward trend, decreasing from 69% in 1995 to 55% in 2020. It predicted to drop to 50% in 2025. The figure for people obtaining news from newspaper dropped gradually from 58% in 1995 to 33% in 2020. It will decrease slightly to 33% in 2025. Similarly, the percentage of people obtaining news from radio showed a steady fall from 52% to 29% between 1995 and 2020. In prediction, it will drop to 22% in next 5 years.
รายละเอียดตัวอย่าง
The graph below shows the percentage of people accessing news from four sources from 1995 and projection to 2025. Summarise the information by selecting and reporting the main features, and make comparisons where relevant.
22/07/2026 02:23 7.0 คะแนน
หัวข้อ
The graph below shows the percentage of people accessing news from four sources from 1995 and projection to 2025. Summarise the information by selecting and reporting the main features, and make comparisons where relevant.
จำนวนคำ: 177
แผนภูมิ/กราฟ
Essay
คะแนนรวม
7.0±0.5
ดีมาก
คะแนนเกณฑ์การเขียน
TA7.0
CC7.0
LR7.0
GRA7.0
คลิกข้อความที่ไฮไลต์ในเรียงความเพื่อดูคำแนะนำรายละเอียดเพื่อพัฒนา
การวิเคราะห์เชิงลึก
Task 1 - Academic Writing
4 tools available
บทความตัวอย่าง - IELTS Writing Task 1
ยังไม่มีบทความตัวอย่าง
กดปุ่มด้านล่างเพื่อวิเคราะห์และสร้างบทความตัวอย่างคุณภาพสูงสำหรับ Task 1