
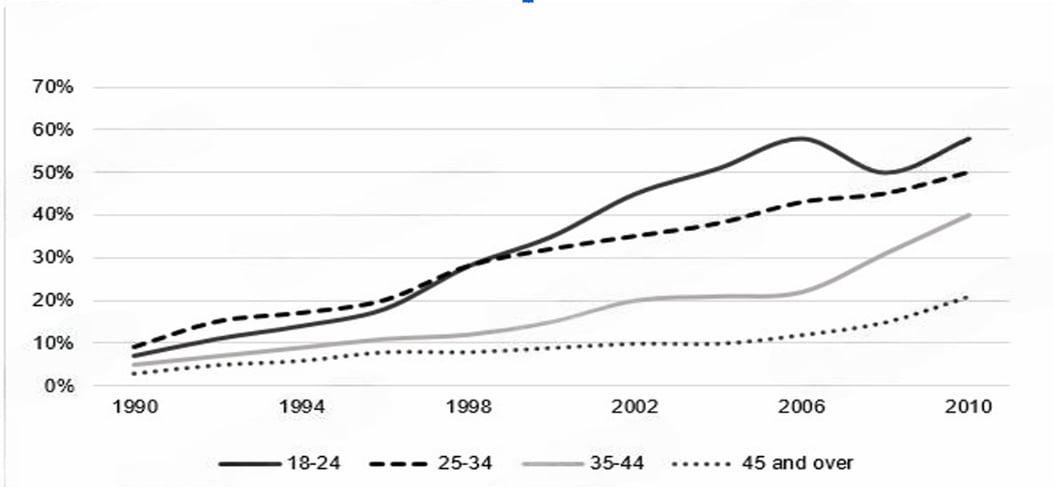
The given picture illustrates the proportion of European civilians going to gyms over once a month across four groups of age from 1990 to 2010. Overall, all the range of age that was documented saw a clear upward trend. Notably, while the significant growth belonged to the figure for 18-24, the 45 and over group stood at the bottom position throughout the period below Looking at the two categories with the most radical change, 18-24 came second with 8% of their people going to the gym, followed by the 35-44 which had the percentage of 5% in 1990. Both of them initially edged up to 27% for the former and 12% for the later by 1998, after which fluctuated but still surged remarkably to end the period at 57% and 40% respectively by 2010. Regarding the two remaining sectors, the 25-34 started as the dominant group in 1990 before increasing moderately to 27% in 1998, yet this one relinquished leadership to the 18-24 in 1998. Its figure finally rose gradually to close the time frame at 50%. In addition, the people over 45 years observed a slow but consistent growth to over 20% in the end of the period.
Detail Sampel
The chart below gives information about European people of different age groups who went to gyms once a month or more between 1990 and 2010.
22/07/2026 02:32 6.5 skor
Topik
The chart below gives information about European people of different age groups who went to gyms once a month or more between 1990 and 2010.
Jumlah kata: 199
Grafik/Diagram
Essay
Skor Keseluruhan
6.5±0.5
Cukup
Skor Kriteria Writing
TA6.0
CC7.0
LR6.0
GRA7.0
Klik teks yang ditandai di esai untuk melihat saran detail untuk peningkatan.
Analisis mendalam
Task 1 - Academic Writing
4 tools available
Esai contoh - IELTS Writing Task 1
Belum ada esai contoh
Silakan klik tombol di bawah untuk menganalisis dan membuat esai contoh berkualitas tinggi untuk Task 1.