
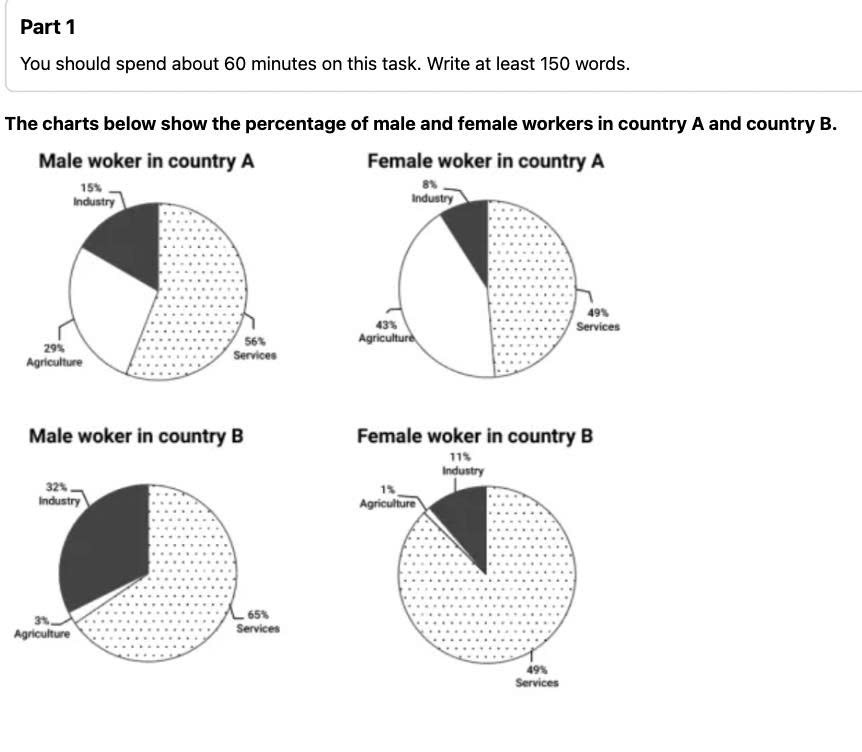
The given pies compare the proportion of men and women who work in industry, agriculture and services sectors in country A and country B. From an overall perspective, it is evident that the largest percentage in four charts belonged to services. Also noticeable was that country A witnessed the second rank of agriculture and the third for industry in both male and female employers, whereas country B showed a reverse tendency. Looking at country A in more closely, one can see that both genders employed in the services field occupied the highest figure at 56% and 49%, respectively. This was followed by agriculture, at 29% with men and 43% with women, while the proportion of industry accounted for the lowest value at 15% for male workers and 8% for females. Turning to country B, the data on services were also greatest, making up 11% higher than male workers in country A and remained unchanged with the proportion of females. The opposite trend can be seen in the percentage of agriculture, both male and female employers, comprised the smallest at only 3% and 1%. Finally, industry recorded 32% as the figure for men and 11% for women.
नमूना विवरण
The charts below show the percentage of male and female workers in country A and country B
22/07/2026 02:49 6.5 अंक
विषय
The charts below show the percentage of male and female workers in country A and country B
शब्दों की संख्या: 196
चार्ट/ग्राफ
Essay
समग्र स्कोर
6.5±0.5
ठीक
राइटिंग मानदंड स्कोर
TA7.0
CC7.0
LR6.0
GRA7.0
सुधार के विस्तृत सुझाव देखने के लिए लेख में किसी भी हाइलाइट किए गए टेक्स्ट पर क्लिक करें।
गहन विश्लेषण
Task 1 - Academic Writing
4 उपकरण उपलब्ध
नमूना लेख - IELTS Writing Task 1
कोई नमूना लेख नहीं
Task 1 के लिए उच्च-गुणवत्ता वाला नमूना लेख विश्लेषण और बनाने के लिए नीचे दिए गए बटन पर क्लिक करें।