
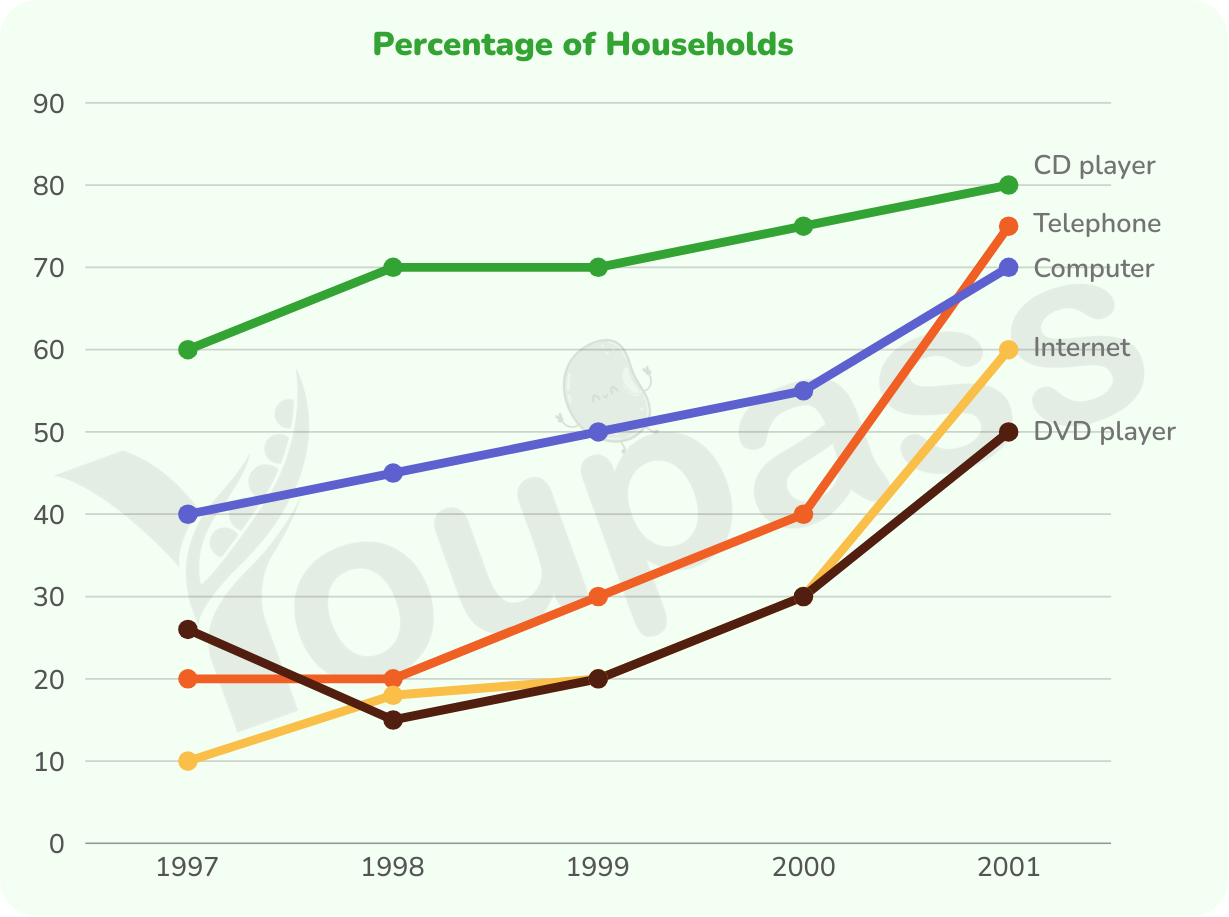
The line graph compare the five different propotions of household with types of technological itemsin the UK over a 4-year eriod between 1997 and 2001. Overall, it is clear from the chart that there was an upward trend in the percentages of five different kinds of technology. Another noticeable point is that the figure for CD player recorded the highest number over the period, while that of DVD was the least figure at the end. Regarding the two technological items which were the most popular, the figure for CD player headed the list with 60 percent, followed by that of computer, which was 40 percent in 1997. At this point, the percentage of computer increased steadily by 10 percent per year until 2000, before experienced a significant growth of 15 percent to reach 70 percent in 2001. Meanwhile, that of CD witnessed both dramatic increases and remained period from 1998 to 1999, then grew significantly by ten percent to reach the highest figure among five kinds, which was 80 percent. Regarding the other three items in 1997, the figure fore DVD was the highest number, which was just under 30 percent, followed by telephone with 20 percent, while that of internet was the least figure, 10 percent. After that year, while the proportion of DVD player experienced a decrease by 10 percent, before bumping by 35 percent to reach 50 percent in 2001, the other two items increased steadily by 50 percent to reach 75 percent and 60 percent, which was telephone and internet respectively.
รายละเอียดตัวอย่าง
The graph below shows the percentage of households with different kinds of technology in the UK from 1997 to 2001. Summarize the information by selecting and reporting the main features, and make comparisons where relevant.
22/07/2026 02:58 5.5 คะแนน
หัวข้อ
The graph below shows the percentage of households with different kinds of technology in the UK from 1997 to 2001. Summarize the information by selecting and reporting the main features, and make comparisons where relevant.
จำนวนคำ: 255
แผนภูมิ/กราฟ
Essay
คะแนนรวม
5.5±0.5
พื้นฐาน
คะแนนเกณฑ์การเขียน
TA6.0
CC6.0
LR5.0
GRA6.0
คลิกข้อความที่ไฮไลต์ในเรียงความเพื่อดูคำแนะนำรายละเอียดเพื่อพัฒนา
การวิเคราะห์เชิงลึก
Task 1 - Academic Writing
4 tools available
บทความตัวอย่าง - IELTS Writing Task 1
ยังไม่มีบทความตัวอย่าง
กดปุ่มด้านล่างเพื่อวิเคราะห์และสร้างบทความตัวอย่างคุณภาพสูงสำหรับ Task 1