
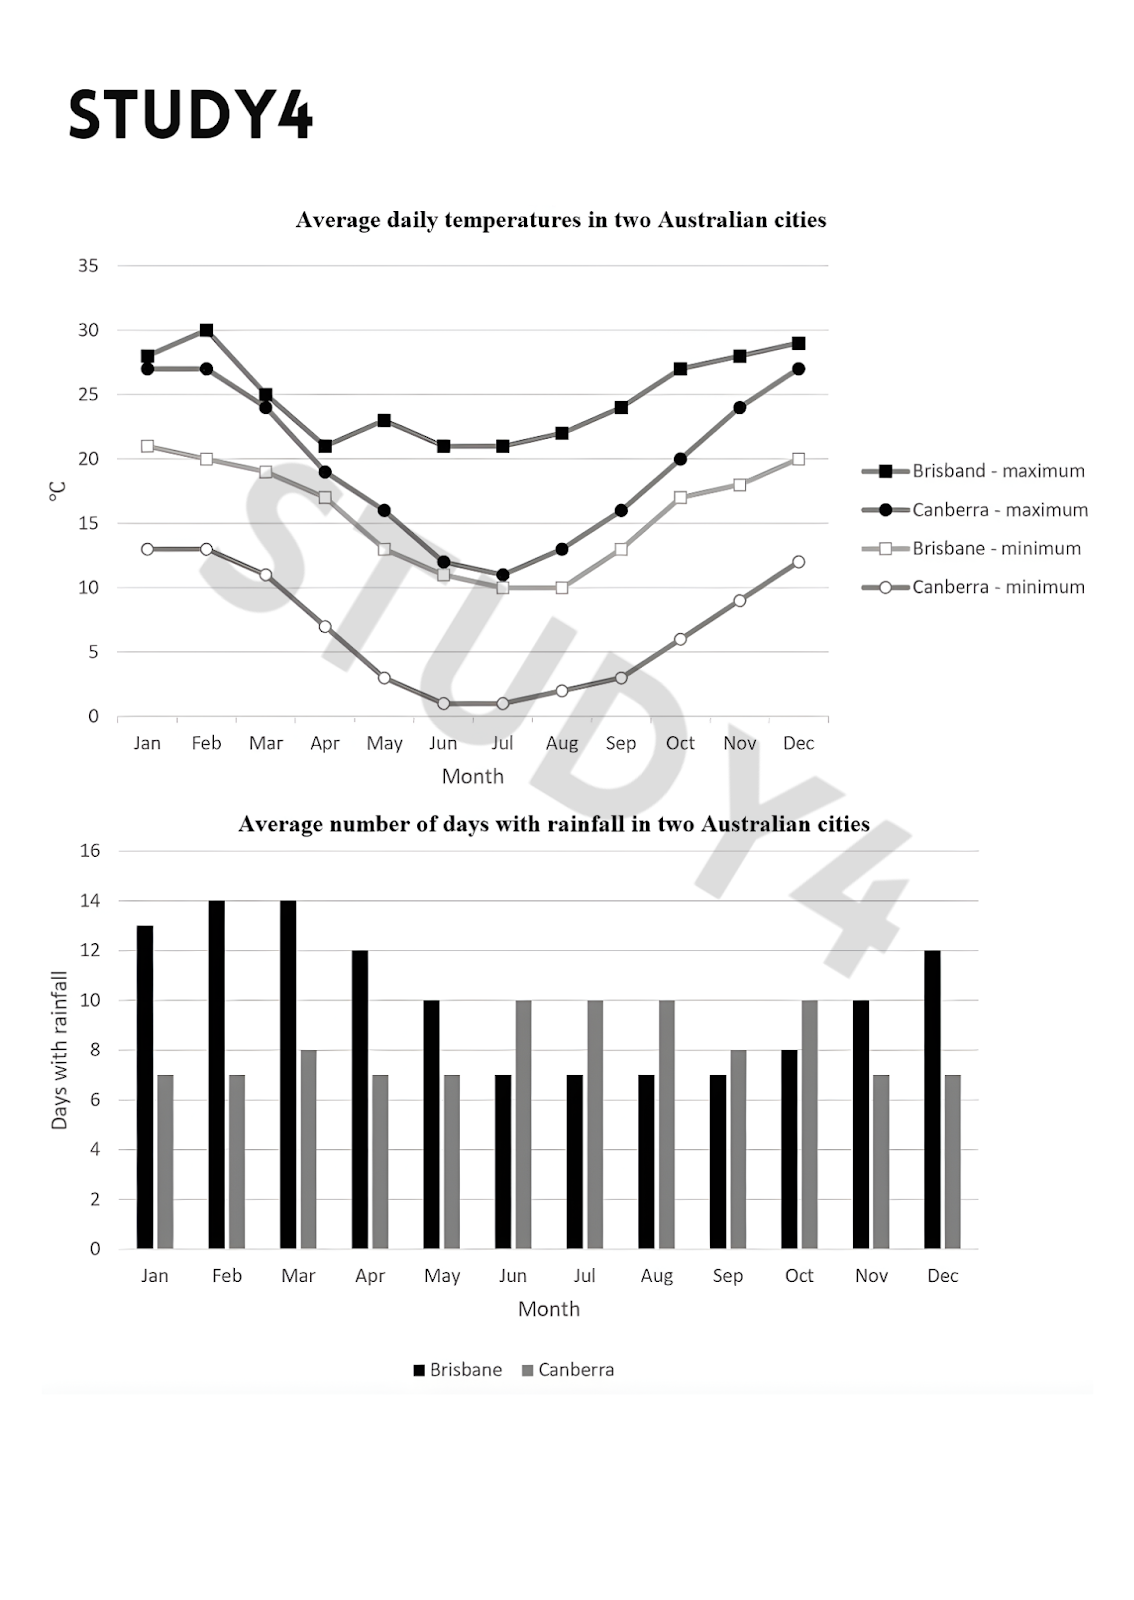
The graph and chart below give information on the average daily maximum and minimum temperatures in degrees Celsius (°C) and the average number of days with rainfall each month for two Australian cities. The graph and chart illustrate the changes in the average maximum and minimum temperatures on a daily basis, measured in degrees Celsius, and the average number of days with rainfall in Brisbane and Canberra in twelve months. Overall, january and december recorded the highest temperatures among all months. Despite decreasing sharply in the first half of the year, the temperature recovered strongly in both cities afterwards. Additionally, at every point, Brisbane exceeds that of Canberra. Meanwhile, Canberra has more days with rainfall of the two cities in five out of 12 months. Looking first at the average daily temperature, the maximum temperature in Brisbane starts at around 28 degrees Celsius, followed closely by that of Canberra, at roughly 26 degrees Celsius. After fluctuating between january and june, Brisbane sees a gradual climb to approximately 29 degrees Celsius. On the other hand, Canberra plummets to its lowest point at around 11 degrees Celsius in July before surging back to its initial level. As for the minimum temperatures, both figures follow a similar pattern over the twelve months. These figures decrease steadily from January to July and then climb back to their starting points. Turning to the days with rainfall, Brisbane commenced the year with roughly 13 days, almost doubling the figure for Canberra at approximately 7 days. The number of days in Brisbane reaches a peak of 14 days before witnessing a steady drop of roughly 7 days from march to june. After remaining unchanged until september, this number rises sharply to 12 days by the end of the year. Meanwhile, the figures for Canberra stay relatively stable in the first five months and then increase to 10 days, staying constant until August. Canberra sees a fluctuation in the following months before settling at a low of around 7 days.
Sample Detail
The graph and chart below give information on the average daily maximum and minimum temperatures in degrees Celsius (°C) and the average number of days with rainfall each month for two Australian cities.
22/07/2026 03:44 7.5 points
Topic
The graph and chart below give information on the average daily maximum and minimum temperatures in degrees Celsius (°C) and the average number of days with rainfall each month for two Australian cities.
Word count: 332
Chart/Graph
Essay
Overall Scores
7.5±0.5
Good
Writing Criteria Scores
TA8.0
CC8.0
LR7.0
GRA8.0
Click on any highlighted text in the essay to view detailed suggestions for improvement.
Deep Analysis
Task 1 - Academic Writing
4 tools available
Sample Essay - IELTS Writing Task 1
No sample essay
Click the button below to analyze and generate a high-quality sample essay for Task 1.