
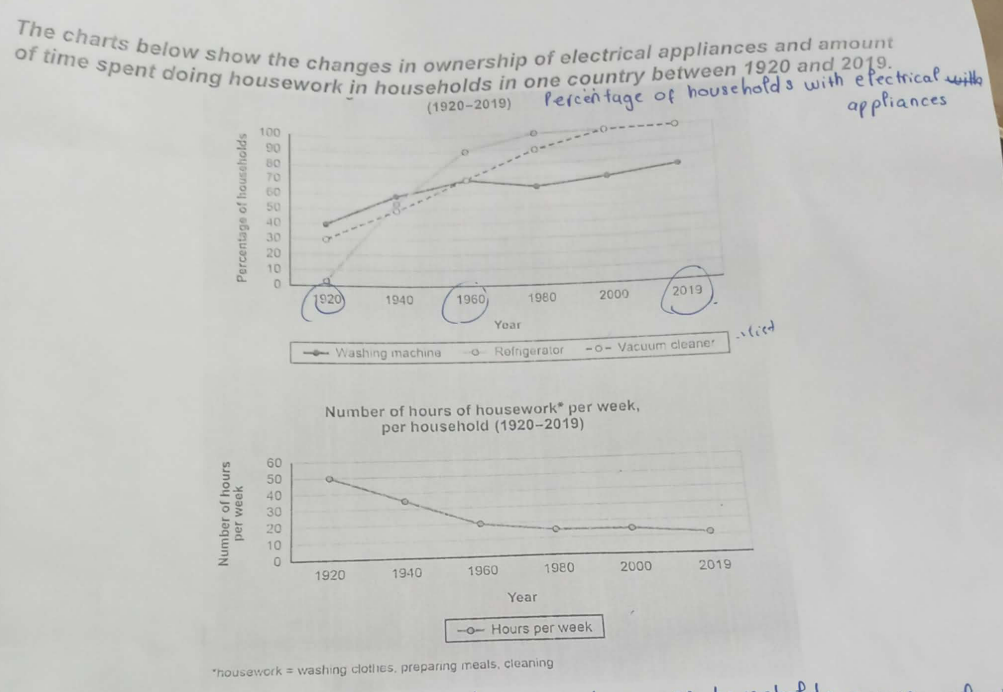
The chart demonstrates the changes in the percentage of households owning electrical devices such as washing machines, refrigerators, vacuum cleaners and the number of hours spent doing chores in one country from 1920 to 2019. It is clear that the proportion of ownership of electrical appliances increased dramatically between 1920 and 2019. Otherwise, the trend for the amount of time that people spent on household chores declined considerably. In 1920, the percentage of households owning refrigerators was the lowest, almost zero percent, while those of vacuum cleaners and washing machines were 30 percent and 40 percent, respectively. The number of hours of housework, which is correlated with those were the highest of all time, roughly 50 hours. In 1960, the figures for three electrical devices went up significantly. In particular, the percentage of ownership of refrigerators reflected the most noticeable change, rising to 90 percent. This year also marked the point at which ownership of vacuum cleaners overtook ownership of washing machines to become one of the highest percentages of households owning electrical devices. These percentages both rose to 70 percent in 1960. As a result, the amount of time people spent on doing housework decreased considerably to 20 hours. In 2019, the figures for these percentages all experienced a slight increase. The percentages of ownership of refrigerators and vacuum cleaners reached their peaks at 100 percent, while the one for washing machines was lower, approximately over 70 percent. Furthermore, the figures for the number of hours doing chores also hit the lowest at about 10 percent.
รายละเอียดตัวอย่าง
The charts below show the changes in ownership of electrical appliances and amount of time spent doing housework in households in one country between 1920 and 2019
22/07/2026 03:43 6.0 คะแนน
หัวข้อ
The charts below show the changes in ownership of electrical appliances and amount of time spent doing housework in households in one country between 1920 and 2019
จำนวนคำ: 257
แผนภูมิ/กราฟ
Essay
คะแนนรวม
6.0±0.5
ดีพอใช้
คะแนนเกณฑ์การเขียน
TA6.0
CC7.0
LR6.0
GRA6.0
คลิกข้อความที่ไฮไลต์ในเรียงความเพื่อดูคำแนะนำรายละเอียดเพื่อพัฒนา
การวิเคราะห์เชิงลึก
Task 1 - Academic Writing
4 tools available
บทความตัวอย่าง - IELTS Writing Task 1
ยังไม่มีบทความตัวอย่าง
กดปุ่มด้านล่างเพื่อวิเคราะห์และสร้างบทความตัวอย่างคุณภาพสูงสำหรับ Task 1