
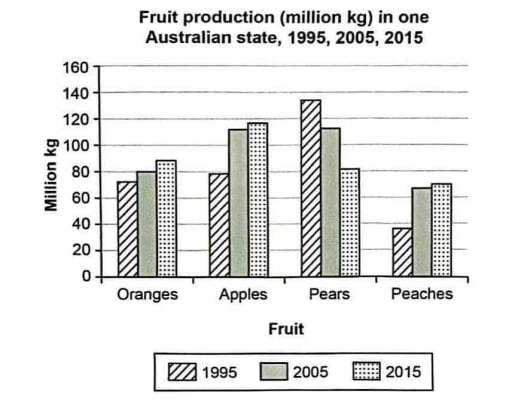
The bar chart compares the production volume of four different common fruits — orange, apple, pear, and peach —in an Australian region in three distinct years (1995, 2005, and 2015), measured in million kilogram. Overall, pear predominately produced initially, but the production of apple then outproduced by a wide margin, with its figures increasing markedly over time. Meanwhile, the output of orange and peach increased gradually, albeit to varying degrees, while that of pear decreased significantly over the timeframe. Notably, despite increasing figures, the amount of produced peach remained the least productive fruit , whereas pear experienced the most pronounced change over the same period. Turning to the increased categories, the yield of apple in this state grew gradually and significantly throughout the entire period, making it the dominant produced fruit. Starting at around 80 million kilogram, the figure rose to approximately 110 million kilogram a decade later, registering the highest a decade production figure and reaching parity with the figure for pear in the same year, before increasing to its peak of more or less 118 million kilogram in the final year. The output of orange, on the other hand, saw a moderate growth, increasing from an initial of approximately 78 million kilogram, prior to climbing to 80 million kilogram in 2005, a figure than then finished at virtually 90 million kilogram in 2015. Similarly, peach saw its production volume increase significantly from about 39 million, the lowest figure in the chart, to about 65 million kg, prior to growing to approximately 70 million kg in 2015. As for the decreasing figure, only in the case of pear did its output decrease over the period. Starting at a chart-high of about 138 million kg in the initial year, the figure that then decreased noticeably to 110 million in the second year, before finishing at more or less 80 million in the final year.
Detail Sampel
The bar chart shows the production of fruits by weight in the years of 1995, 2005, 2015.
22/07/2026 03:52 7.0 skor
Topik
The bar chart shows the production of fruits by weight in the years of 1995, 2005, 2015.
Jumlah kata: 314
Grafik/Diagram
Essay
Skor Keseluruhan
7.0±0.5
Baik
Skor Kriteria Writing
TA7.0
CC8.0
LR7.0
GRA7.0
Klik teks yang ditandai di esai untuk melihat saran detail untuk peningkatan.
Analisis mendalam
Task 1 - Academic Writing
4 tools available
Esai contoh - IELTS Writing Task 1
Belum ada esai contoh
Silakan klik tombol di bawah untuk menganalisis dan membuat esai contoh berkualitas tinggi untuk Task 1.