
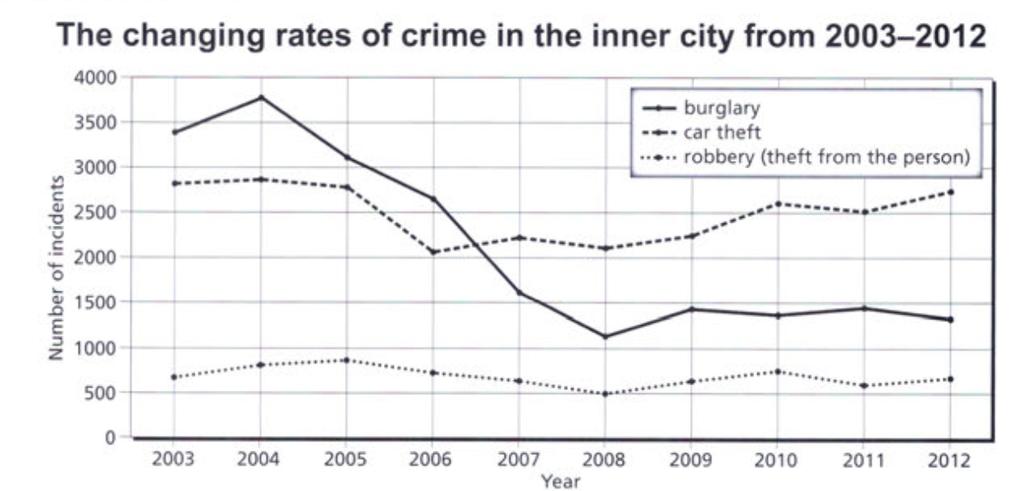
The given line graph gives information about the shift that took place in three different areas of crime in Newport city centre over a period of 9 years, from 2003 to 2012. Overall, the quantity of criminal acts in burglary experienced a sharp dive over a period. By contrast, the number of incidents in car theft and robbery showed a fluctuation between 2003 and 2012, but the number at the end was not changed compared with the beginning. At the beginning, the number of crimes in burglary was the highest at about 3400. Then this number reached the highest point of 3800 in 2004. However, a dramatic decline was recorded in the number of incidents in burglary from 3800 to around 1400 at the end. The quantity of robbery crimes in the inner city was the lowest during the given period. This number fluctuated slightly between 2003 and 2012, but this number not different between the beginning and the end, about 600. The number of car theft crimes remained stable from 2003 to 2005, around 2800. Then there was a sudden drop in 2006 to 2000. The quantity of car theft incidents saw a gradual rise within 6 years from 2006 to 2012, over 2700 at the end.
Sample Detail
The chart below shows the changes that took place in three different areas of crime in Newport city centre from 2003-2012. Summarize the information by selectin and reporting the main features and make comparisons where relevant.
22/07/2026 04:33 6.5 points
Topic
The chart below shows the changes that took place in three different areas of crime in Newport city centre from 2003-2012. Summarize the information by selectin and reporting the main features and make comparisons where relevant.
Word count: 208
Chart/Graph
Essay
Overall Scores
6.5±0.5
Fair
Writing Criteria Scores
TA7.0
CC7.0
LR6.0
GRA6.0
Click on any highlighted text in the essay to view detailed suggestions for improvement.
Deep Analysis
Task 1 - Academic Writing
4 tools available
Sample Essay - IELTS Writing Task 1
No sample essay
Click the button below to analyze and generate a high-quality sample essay for Task 1.