
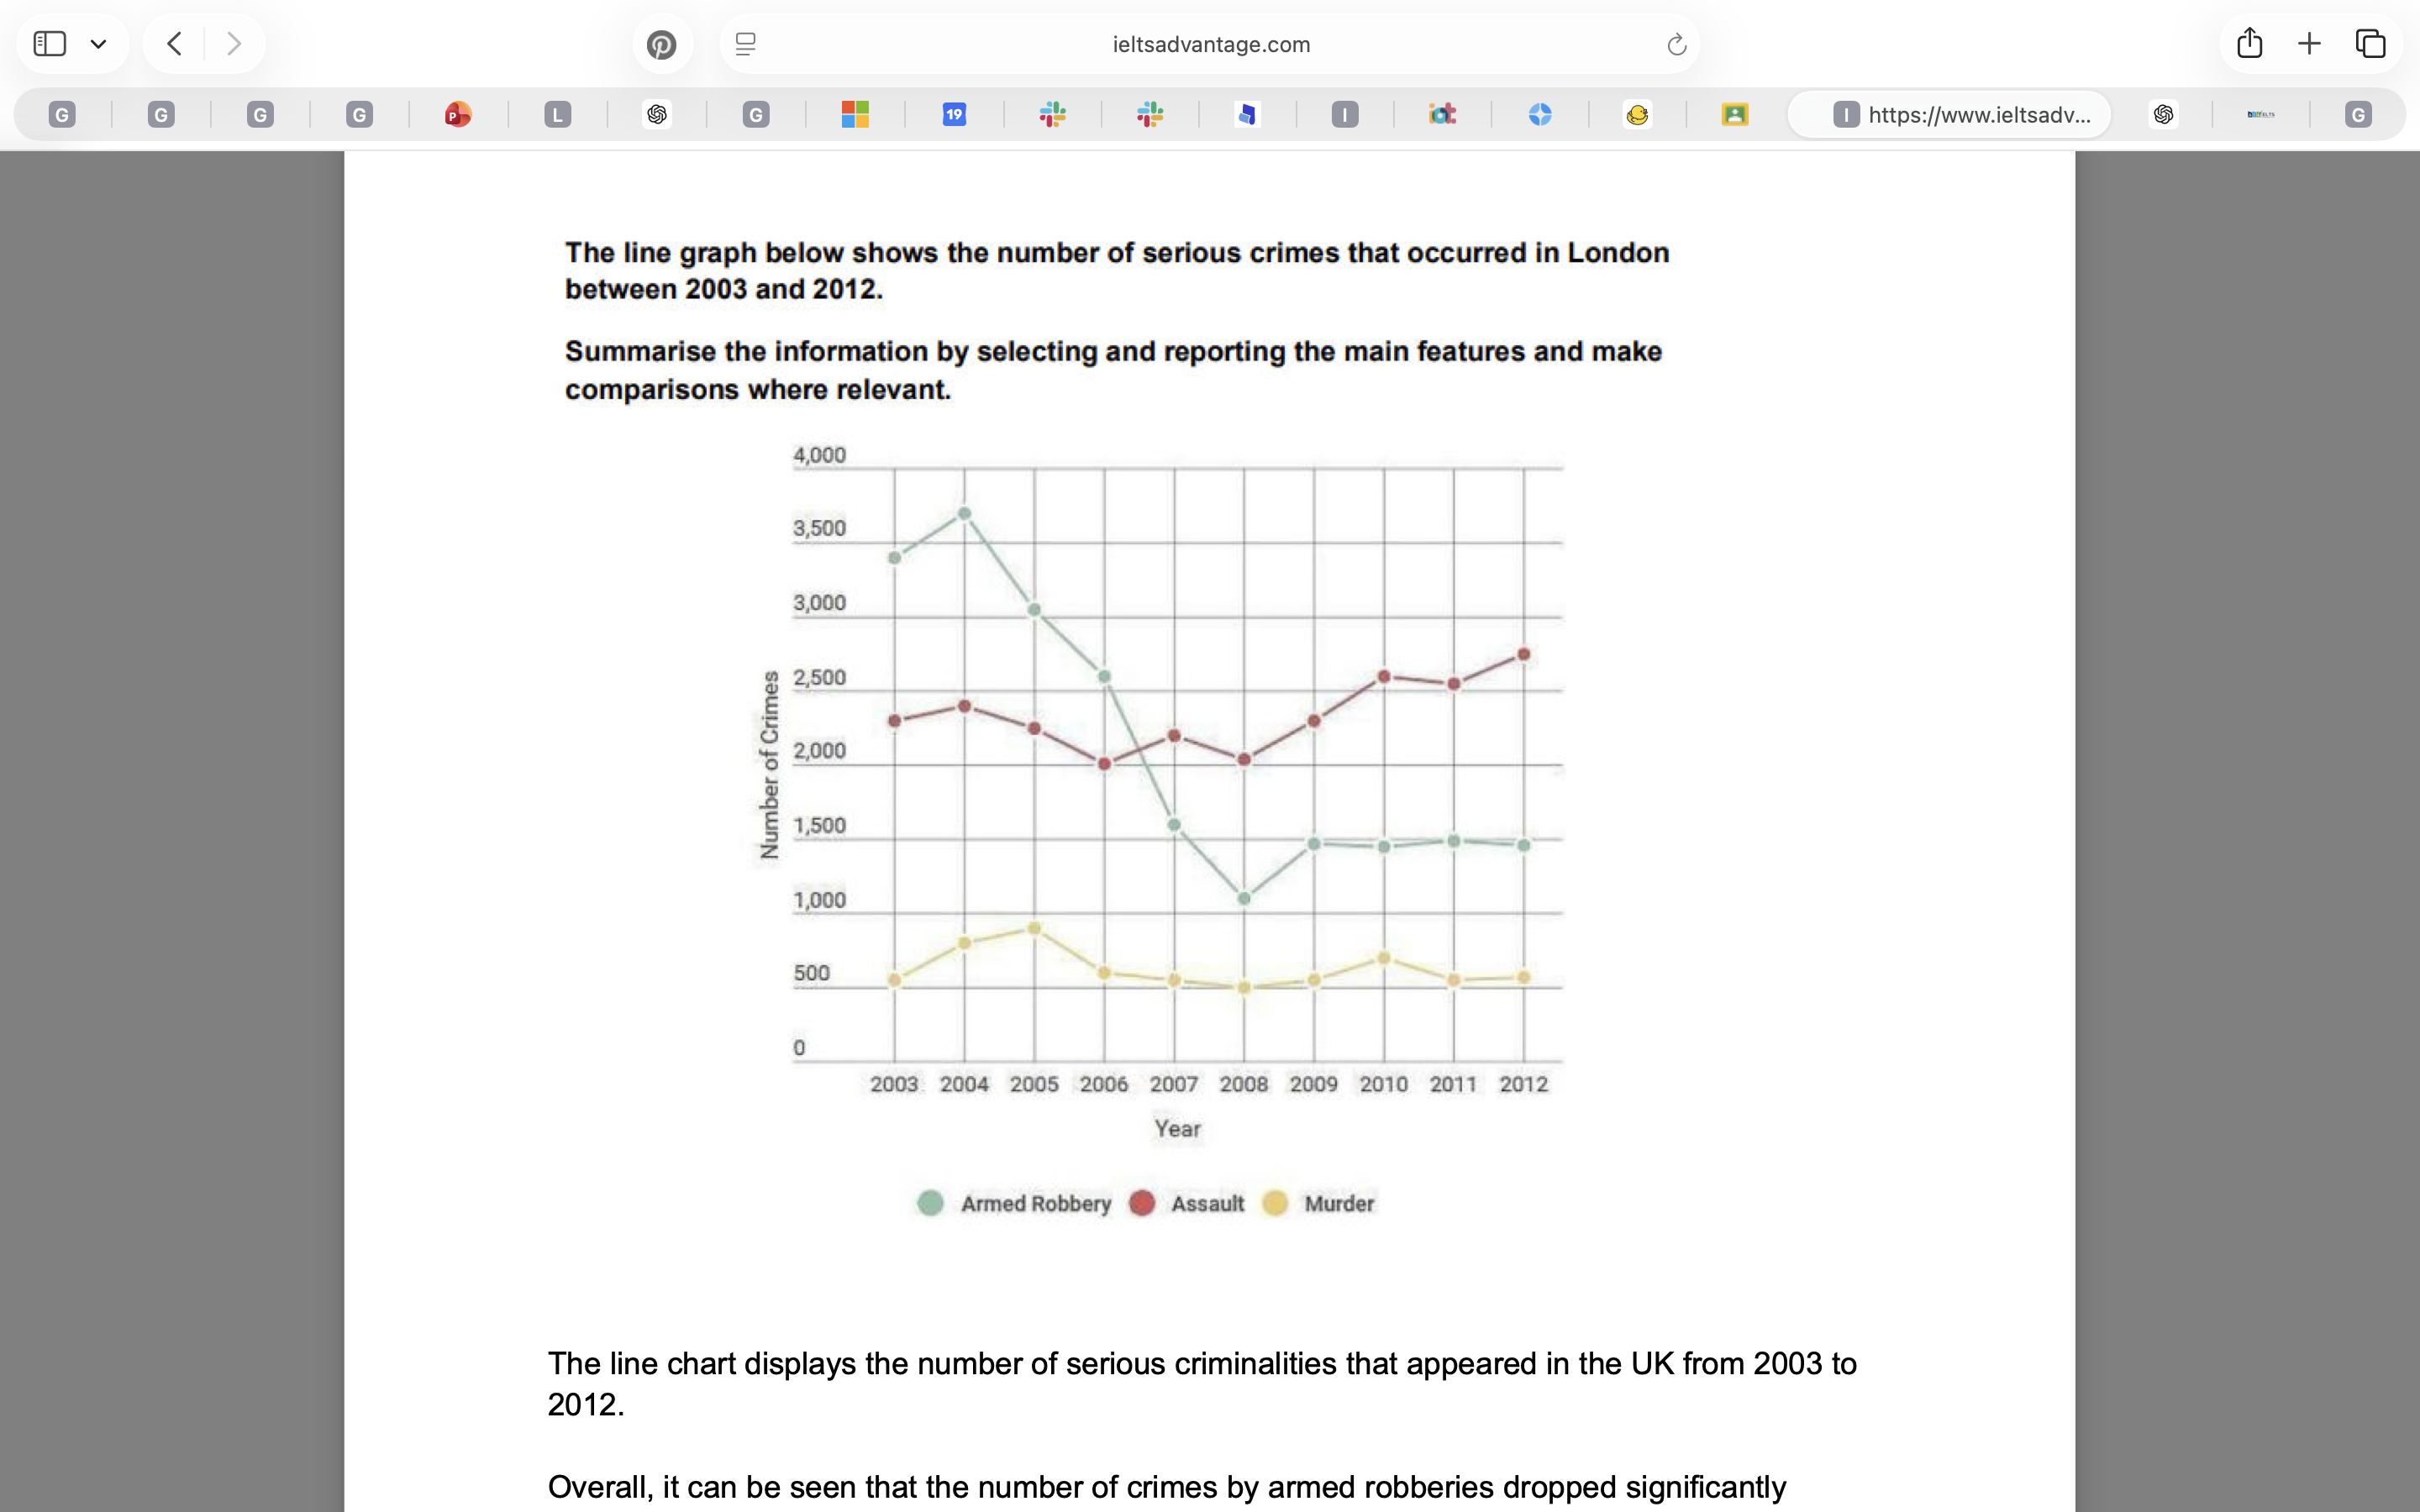
The chart illustrates the information of the serious crimes that happened in London from 2003 to 2012. Overall, it is evident that assault and murder numbers are constant over the years. But on the other hand armed robbery started out the most common crime but plummeted over time. Armed robbery’s number started at 3400 in 2003 and the number increased by nearly 300 reaching the peak in 2004. It was the highest rate until 2008. The number shows a steep fall from 3700 to 1100. Until 2009 it rose slightly to 1500. The number remained unchanged till 2012. The number of assaults started from 2400 in 2003. This gradually increased progressively till 2010 reaching 2600. Surpassing the number of armed robbery making the highest number of crime in 2012. The cases of the murder stayed the lowest number of crime compared to the other two crimes. The highest point was nearly making up to 1000 in 2005. After it declined slightly in one year, the number remained stable until 2012.
नमूना विवरण
The line graph below shows the number of serious crimes that occurred in London between 2003 and 2012. Summarise the information by selecting and reporting the main features and make comparisons where relevant.
22/07/2026 04:36 5.5 अंक
विषय
The line graph below shows the number of serious crimes that occurred in London between 2003 and 2012. Summarise the information by selecting and reporting the main features and make comparisons where relevant.
शब्दों की संख्या: 170
चार्ट/ग्राफ
Essay
समग्र स्कोर
5.5±0.5
बुनियादी
राइटिंग मानदंड स्कोर
TA5.0
CC6.0
LR6.0
GRA6.0
सुधार के विस्तृत सुझाव देखने के लिए लेख में किसी भी हाइलाइट किए गए टेक्स्ट पर क्लिक करें।
गहन विश्लेषण
Task 1 - Academic Writing
4 उपकरण उपलब्ध
नमूना लेख - IELTS Writing Task 1
कोई नमूना लेख नहीं
Task 1 के लिए उच्च-गुणवत्ता वाला नमूना लेख विश्लेषण और बनाने के लिए नीचे दिए गए बटन पर क्लिक करें।