
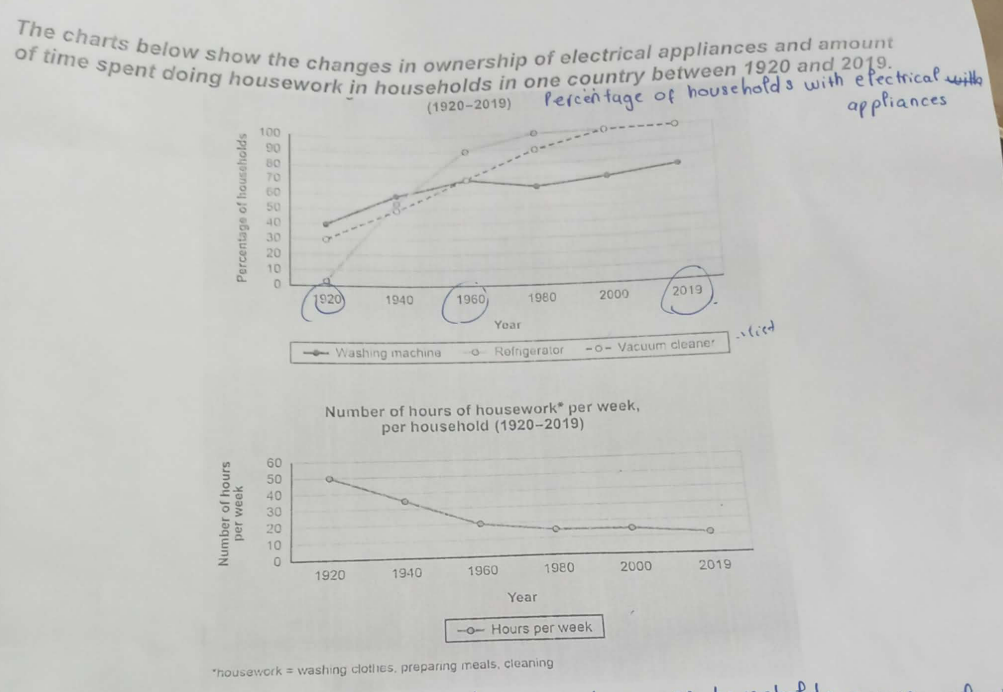
The charts demonstrate the changes in the percentage of households owning electrical devices such as washing machines, refrigerators, vacuum cleaners and the number of hours spent doing chores in one country from 1920 to 2019. It is clear that the proportion of ownership of electrical appliances increased dramatically between 1920 and 2019. By contrast, the trend for hours dedicated to housework declined considerably. In 1920, the percentage of households owning refrigerators was the lowest, almost zero percent, while those of vacuum cleaners and washing machines were 30 percent and 40 percent, respectively. The number of hours of housework, which was at its peak during this period, was roughly 50 hours. In 1960, the figures for the three electrical devices increased significantly. In particular, the percentage of ownership of refrigerators reflected the most noticeable change, rising to 90 percent. This year also marked the point at which ownership of vacuum cleaners overtook that of washing machines to become one of the highest percentages of households owning electrical devices. These percentages both rose to 70 percent in 1960. As a result, the amount of time people spent on doing housework decreased considerably to 20 hours. In 2019, the figures for these percentages all experienced a slight increase. The percentages of ownership of refrigerators and vacuum cleaners reached their peaks at 100 percent, while the one for washing machines was lower, approximately 70 percent. Furthermore, the figures for the number of hours doing chores also hit the lowest at about 10 percent.
Sample Detail
The charts below show the changes in ownership of electrical appliances and amount of time spent doing housework in households in one country between 1920 and 2019
22/07/2026 04:37 6.5 points
Topic
The charts below show the changes in ownership of electrical appliances and amount of time spent doing housework in households in one country between 1920 and 2019
Word count: 249
Chart/Graph
Essay
Overall Scores
6.5±0.5
Fair
Writing Criteria Scores
TA6.0
CC7.0
LR7.0
GRA7.0
Click on any highlighted text in the essay to view detailed suggestions for improvement.
Deep Analysis
Task 1 - Academic Writing
4 tools available
Sample Essay - IELTS Writing Task 1
No sample essay
Click the button below to analyze and generate a high-quality sample essay for Task 1.