
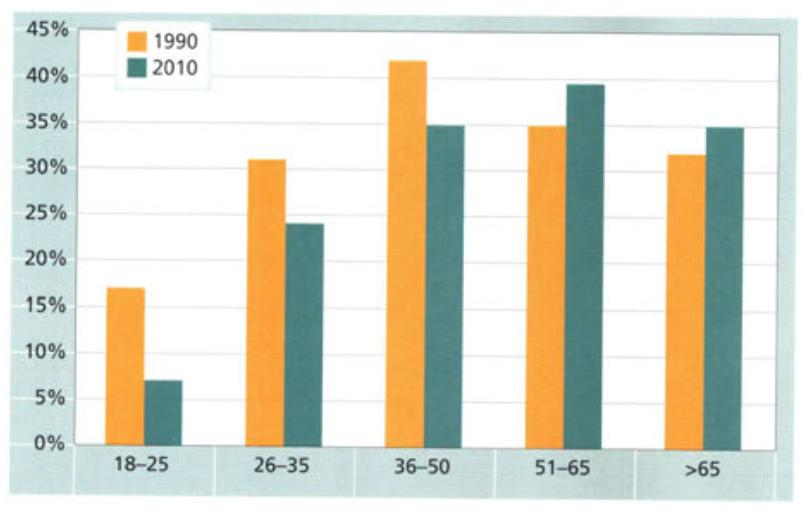
The bar chart illustrates the money that British people donated for charity by different age groups from 1990 to 2010. Overall, in 1990 36-50 group was the most highest figure of people donating to charity, while 51-65 group took the lead in 2010. By contrast, young people 18-25 consistently recorded the lowest proportion in both years. In 1990, middle-aged people 36-50 stood at over 40%, making it the highest percentage, whereas young people 18-25 just at approximately 16%. The 26-35 age range accounted for 31% by far lower than 36-50 age group, with over 40%. For aged groups, people 51-65 made up 35% which was the second-largest figure, compared to people under 65 at 32% In 2010, people 51-65 saw a slight increase to nearly 40% ( the highest figure that year), also people under 65 grew to 35%. In contrast, the remaining age groups declined significantly, with only 6% for minors 18-25. Similarly, both people 26-35 and 36-50 fell sharly to 24%, 35%, respectively.
Detail Sampel
The chart below gives information on the percentage of British people giving money to charity by age range for the years 1990 and 2010. Summarize the information by selecting and reporting the main features and make comparisons where relevant.
22/07/2026 04:39 5.5 skor
Topik
The chart below gives information on the percentage of British people giving money to charity by age range for the years 1990 and 2010. Summarize the information by selecting and reporting the main features and make comparisons where relevant.
Jumlah kata: 165
Grafik/Diagram
Essay
Skor Keseluruhan
5.5±0.5
Dasar
Skor Kriteria Writing
TA6.0
CC6.0
LR5.0
GRA6.0
Klik teks yang ditandai di esai untuk melihat saran detail untuk peningkatan.
Analisis mendalam
Task 1 - Academic Writing
4 tools available
Esai contoh - IELTS Writing Task 1
Belum ada esai contoh
Silakan klik tombol di bawah untuk menganalisis dan membuat esai contoh berkualitas tinggi untuk Task 1.