
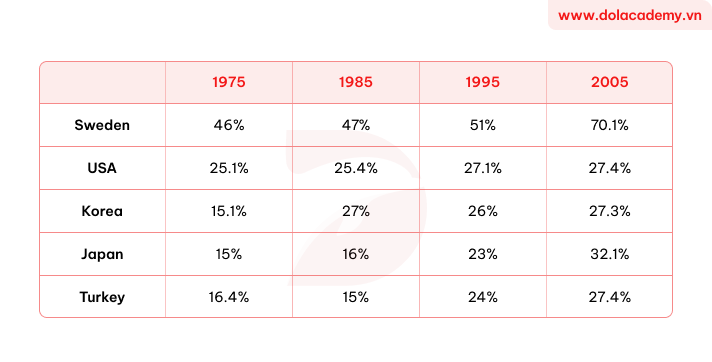
The table shows the percentage of GDP tax in 5 countries over 4 years between 1975 and 2005. It is clear that almost all the countries experienced an increase in the amount of tax collected over the 4 years, with the exception of fluctuation in Korea and Turkey. Sweden collected the highest tax among the 5 countries. The percentage of tax in Sweden rose significantly from 46% in 1975 and reached a peak of 70.1% in 2005, which was the highest value recorded. Additionally, the amount of tax collected in the USA increased slightly during the period from 25.1% in 1975 to 27.4% in 2005. Similarly, the percentage of GDP in Japan rose dramatically from 15% to 32.1% by the end of the period, which represented an increase of approximately two times. By contrast, the amount of tax in Turkey dipped slightly from 16.4% in 1975 to 15% in 1985, before increasing significantly to 27.4% in 2005. While the percentage of tax in Korea edged upward from 1975 to 1985, this figure then dropped to 26% in 1995 and experienced its highest recorded value during the period at 27.4%.
नमूना विवरण
The table below gives the information about the amount of tax collected (as % of GDP) in five countries for 4 years between 1975 and 2005.
22/07/2026 04:44 7.0 अंक
विषय
The table below gives the information about the amount of tax collected (as % of GDP) in five countries for 4 years between 1975 and 2005.
शब्दों की संख्या: 189
चार्ट/ग्राफ
Essay
समग्र स्कोर
7.0±0.5
अच्छा
राइटिंग मानदंड स्कोर
TA7.0
CC7.0
LR7.0
GRA7.0
सुधार के विस्तृत सुझाव देखने के लिए लेख में किसी भी हाइलाइट किए गए टेक्स्ट पर क्लिक करें।
गहन विश्लेषण
Task 1 - Academic Writing
4 उपकरण उपलब्ध
नमूना लेख - IELTS Writing Task 1
कोई नमूना लेख नहीं
Task 1 के लिए उच्च-गुणवत्ता वाला नमूना लेख विश्लेषण और बनाने के लिए नीचे दिए गए बटन पर क्लिक करें।