
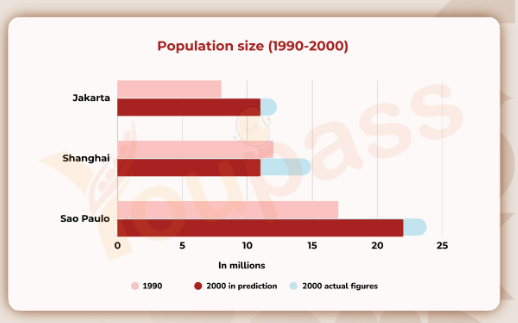
The bar chart compares the population size in 2000 with projected and the actual figures, and adding with actual numbers from 1990 in three different cities, namely Jakarta, Shanghai, and Sao Paulo. Overall, while Jakarta and Sao Paulo were predicted increasing in size of population from 1990 to 2000, Shanghai was opposited with decreasing in size. However, all of them was growth, with Sao Paulo stayed ahead of other cities in population. Looking at Sao Paulo and Jakarta, in 1990, with the former had the largest population in size, which was 17 millions, and only 8 millions for the latter. Both were expected growing in size, Sao Paulo was predicted to rise dramatically to 22 millions, which had the actual figures was higher, at 24 millions. Additionally, Jakarta was also expected up to 11 millions, while the real number was slightly higher, at 12 millions. On the other hand, Shanghai's population was the only one that had the decreasing in 2000 from 12 millions to 11 millions in prediction. Nevertheless, the actual figures for Shanghai in 2000 was unexpected rise to 15 millions. At the end, Shanghai still ranked the second largest in size compared with others
Sample Detail
The chart shows information about the actual and expected figures of population of three cities, Jakata, Sao Paulo, and Shanghai. Summarize the information by selecting and reporting the main features, and make comparisons where relevant.
22/07/2026 04:54 5.5 points
Topic
The chart shows information about the actual and expected figures of population of three cities, Jakata, Sao Paulo, and Shanghai. Summarize the information by selecting and reporting the main features, and make comparisons where relevant.
Word count: 197
Chart/Graph
Essay
Overall Scores
5.5±0.5
Basic
Writing Criteria Scores
TA6.0
CC6.0
LR5.0
GRA5.0
Click on any highlighted text in the essay to view detailed suggestions for improvement.
Deep Analysis
Task 1 - Academic Writing
4 tools available
Sample Essay - IELTS Writing Task 1
No sample essay
Click the button below to analyze and generate a high-quality sample essay for Task 1.