
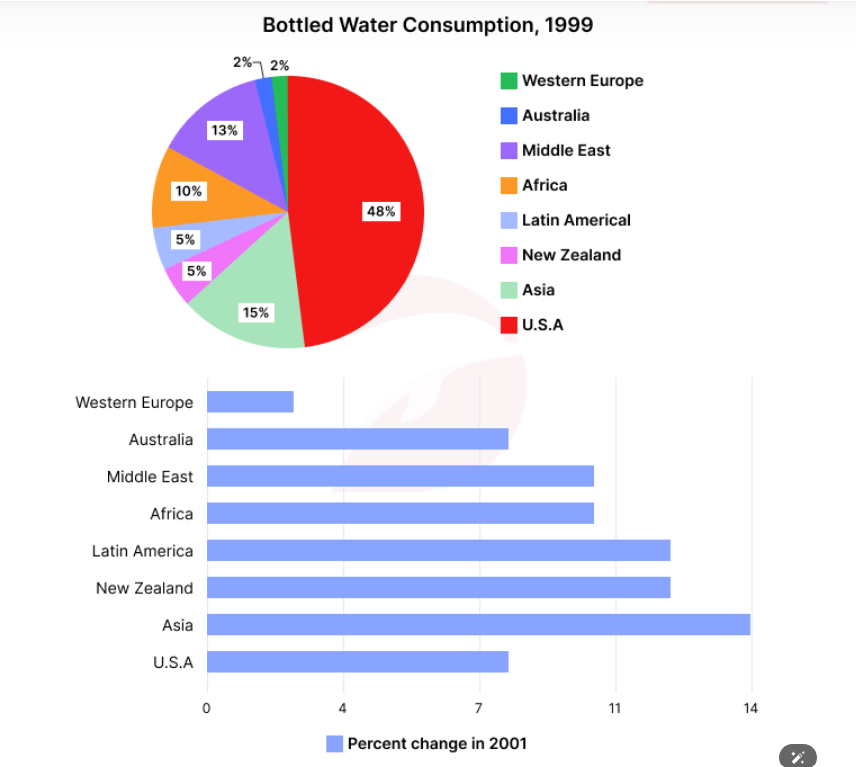
The pie chart illustrates the consumption of bottled water in 8 different nations, measured as a percentage in 1999, while the bar chart gives information on the upward trend of all the mentioned regions recorded in the year 2001. Overall, in 1999, of all the contributors, securing the first position was USA, followed by Asia. After a 2-year period, the percentage of Asia’s bottled water consumed experienced the highest growth of all, in contrast to just a minority of Western Europe. In terms of the USA, it occupied nearly half of the consumed bottled water, solidifying its predominant place. Far below were Asia, the Middle East and Africa, with their respective figures being 15%, 13% and 10%. For the remaining categories, their proportions show marginal discrepancies, spanning from 2% to 5%. Over two years, Asia saw the biggest rise of 14%, slightly higher than roughly 12% in Latin America and New Zealand. Just below were the Middle East and Africa, as they both witnessed the same noteworthy increase of 10%. Meanwhile, although the USA started as the top bottled water-consuming region, it then only increased by 8%, which was as high as that of Australia. Finally, at the bottom of the list came Western Europe, as its percentage registered a unpronounced change of 3%
Sample Detail
The pie graph below shows bottled water consumption in various regions as a percent of global consumption and the bar-chart shows the growth of bottled water consumption in 2001. Summarise the information by selecting and reporting the main features, and make comparisons where relevant.
22/07/2026 04:56 7.0 points
Topic
The pie graph below shows bottled water consumption in various regions as a percent of global consumption and the bar-chart shows the growth of bottled water consumption in 2001. Summarise the information by selecting and reporting the main features, and make comparisons where relevant.
Word count: 214
Chart/Graph
Essay
Overall Scores
7.0±0.5
Good
Writing Criteria Scores
TA7.0
CC7.0
LR7.0
GRA7.0
Click on any highlighted text in the essay to view detailed suggestions for improvement.
Deep Analysis
Task 1 - Academic Writing
4 tools available
Sample Essay - IELTS Writing Task 1
No sample essay
Click the button below to analyze and generate a high-quality sample essay for Task 1.