
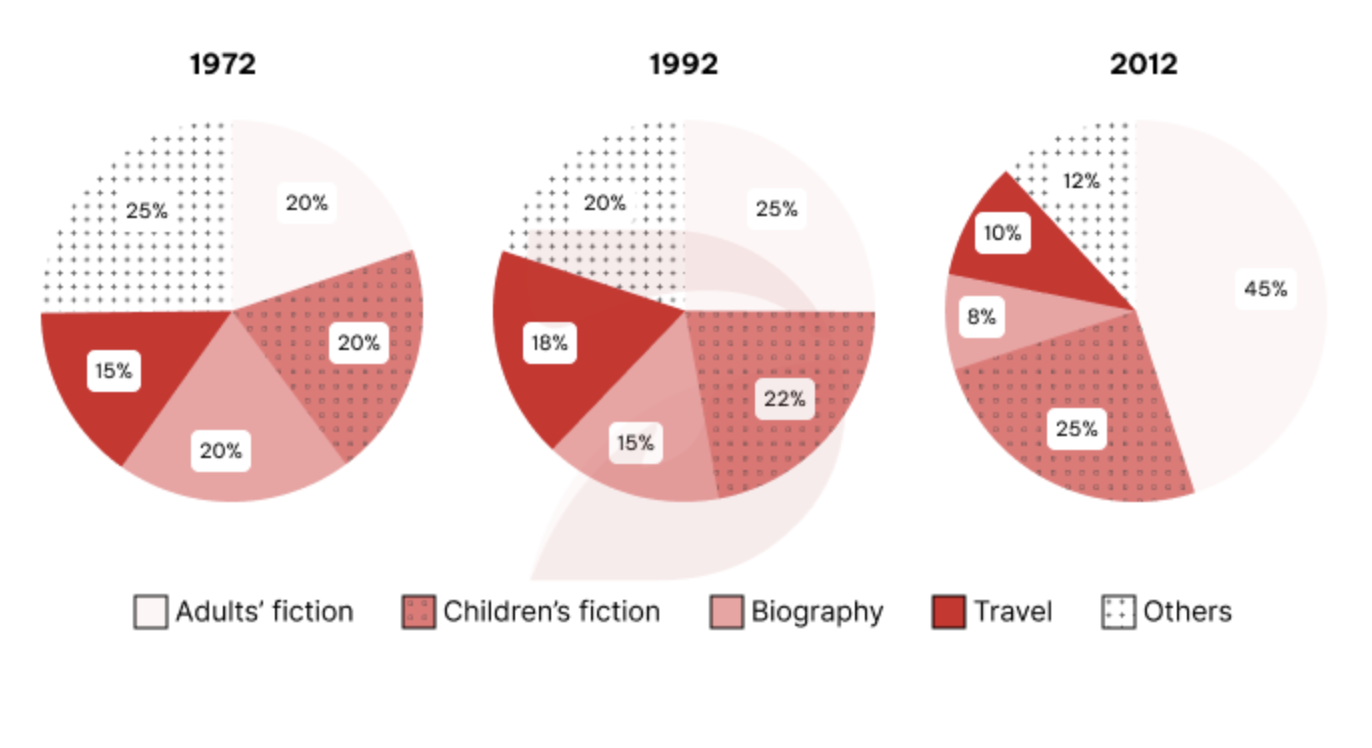
2. The charts indicate the proportion of five types of books sold by seller in 4-decade from 1972. Overall, adult fiction was the book bestseller during the timeframe given. Meanwhile, travel books were recorded a small changes of trend. As can be seen from the charts, adult fiction saw a significant growth. This book accounted for 20% in total books are sold in 1972 and slightly increased to 25% in 20-year laters before reached the first place at nearly a half in 2012. Mirror this trend was children’s fiction, it stood at a lower rate than adult ones with 20% (1972) then upper to 25% in the final time. Regarding the remaining categories, the percentage of biography book saw a noticeable decrease, starting at 20% and declining at 15%. In 2012, this book was the least popular at only 8% by customers’ rating. Meanwhile, there was a fluctuation trend in travel book, beginning at 15% and then increasing slightly at 18% before declining again at 10% in 2012. The final category was others books, it was observed a gradual decline from 25% in 1972 to 20% and 12% after 40 years.
नमूना विवरण
The pie charts below show the percentage of five kinds of books sold by a bookseller between 1972 and 2012. Summarise the information by selecting and reporting the main features, and make comparisons where relevant.
22/07/2026 05:20 6.0 अंक
विषय
The pie charts below show the percentage of five kinds of books sold by a bookseller between 1972 and 2012. Summarise the information by selecting and reporting the main features, and make comparisons where relevant.
शब्दों की संख्या: 191
चार्ट/ग्राफ
Essay
समग्र स्कोर
6.0±0.5
ठीक
राइटिंग मानदंड स्कोर
TA6.0
CC6.0
LR6.0
GRA6.0
सुधार के विस्तृत सुझाव देखने के लिए लेख में किसी भी हाइलाइट किए गए टेक्स्ट पर क्लिक करें।
गहन विश्लेषण
Task 1 - Academic Writing
4 उपकरण उपलब्ध
नमूना लेख - IELTS Writing Task 1
कोई नमूना लेख नहीं
Task 1 के लिए उच्च-गुणवत्ता वाला नमूना लेख विश्लेषण और बनाने के लिए नीचे दिए गए बटन पर क्लिक करें।