
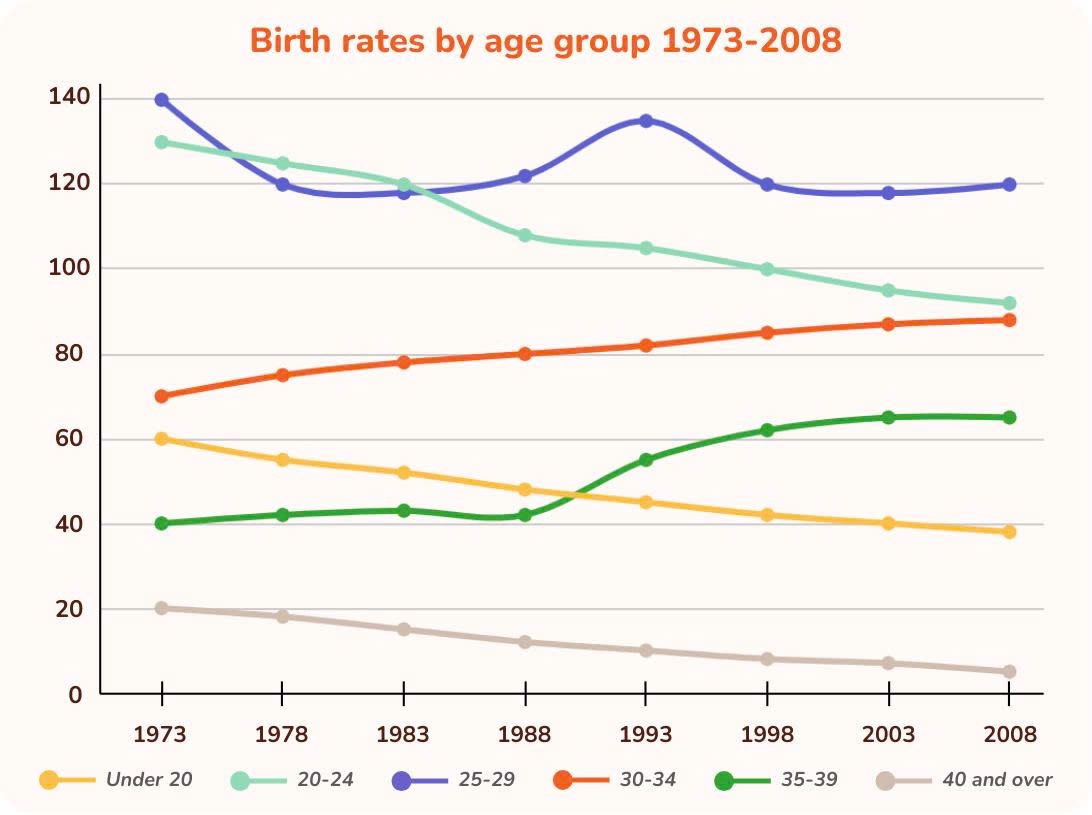
The line graph illustrates the birth rates per 1000 people for six age groups of women in the UK over a 35-year period, from 1973 to 2008. In general, the 30-34 and 35-39 age cohorts exhibited increases in birth rates, while the four other age groups experienced reductions overall. Notably, women aged 25-29 consistently took the largest share for most of the period, whereas the oldest age bracket recorded the lowest figure regardless of time. As for women under 20, in 1973, their birth rates per 1000 people stood at 60 before falling gradually over the period and ending at nearly 40 by 2008. By comparison, the 20-24 age group witnessed a more pronounced downfall. Its figure started at roughly 130 births in 1973, then decreased moderately to approximately 95 births in the final year. Women aged 25-29's birth rates was initially 140. After flutuating between 120 and 135 throughout the timeline, this figure ended the period at 120 births. Regarding the 30-34 and 35-39 age cohorts, their birth rates were about 70 and 40 by 1973, respectively. The former then rose steadily to around 90 by 2008, while the latter remained relatively stable until 1988 before rising remarkably to roughly 65 in the last year. By contrast, women aged 40 and over's birth rates declined persistently from 20 to merely 5 over the period.
Sample Detail
The graph below shows the changes in the birth rates for women in 6 different age groups in the UK from 1973 to 2008 ( per 1000 people ) Summarise the information by selecting and reporting the main features, and make comparisons where relevant.
22/07/2026 05:22 7.5 points
Topic
The graph below shows the changes in the birth rates for women in 6 different age groups in the UK from 1973 to 2008 ( per 1000 people ) Summarise the information by selecting and reporting the main features, and make comparisons where relevant.
Word count: 225
Chart/Graph
Essay
Overall Scores
7.5±0.5
Good
Writing Criteria Scores
TA8.0
CC8.0
LR7.0
GRA8.0
Click on any highlighted text in the essay to view detailed suggestions for improvement.
Deep Analysis
Task 1 - Academic Writing
4 tools available
Sample Essay - IELTS Writing Task 1
No sample essay
Click the button below to analyze and generate a high-quality sample essay for Task 1.