
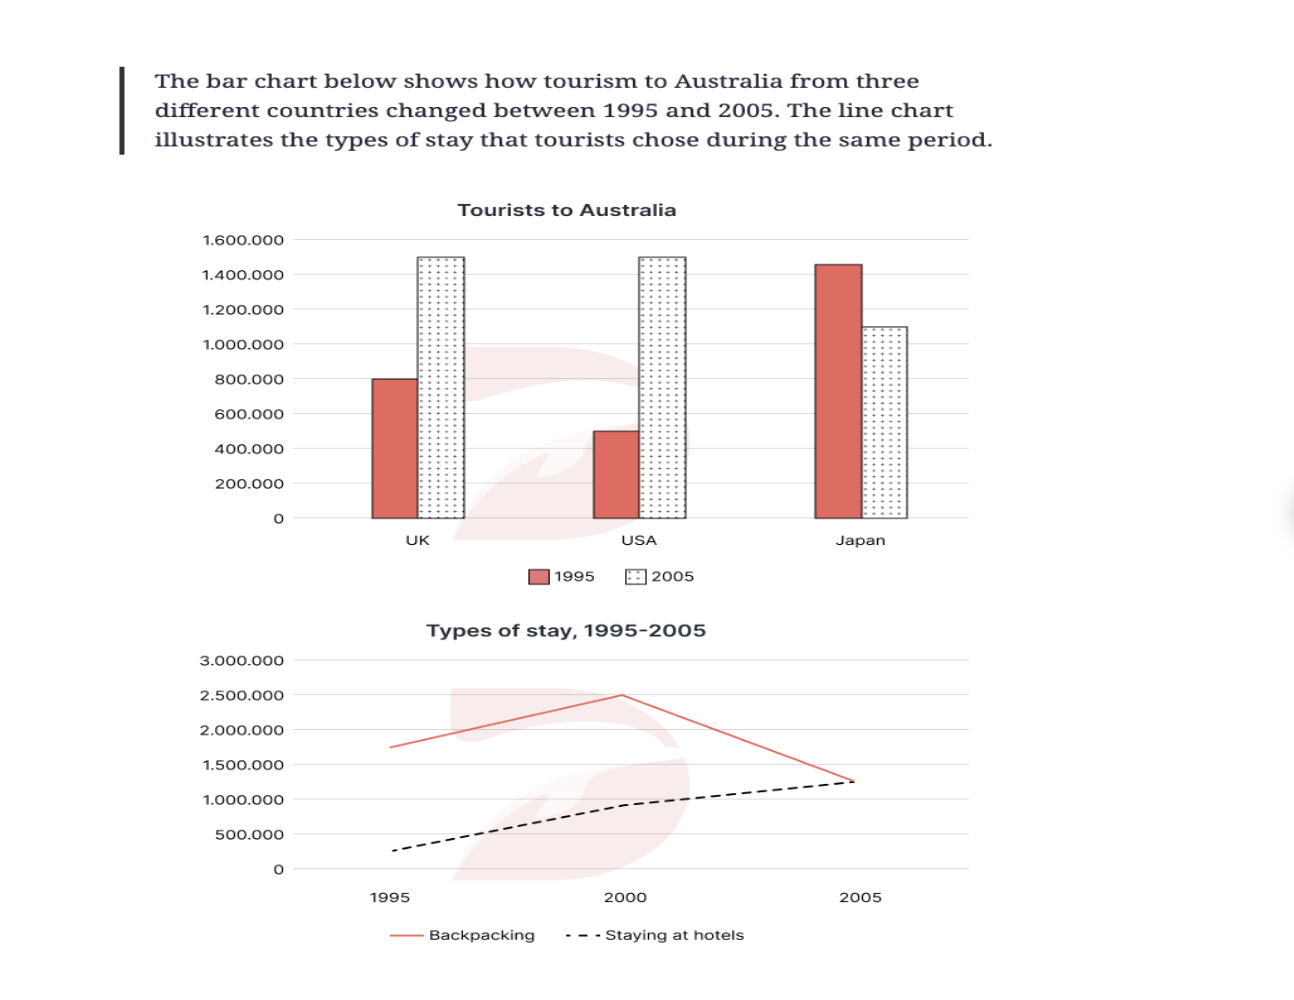
While the bar chart illustrates the variation of tourism in Australia in three distinct countries from 1995 to 2005, the line chart compares two kinds of stay that tourists choose during the same timeframe. Overall, it is readily apparent that the number of tourists to Australia from the UK and the USA displayed upward trends, while the reverse pattern could be observed in Japan. Additionally, even though backpacking was more popular at the beginning of the period, staying at hotels gradually became the dominant choice and reached the same level as backpacking by 2005. In terms of tourism to Australia by 1995, Japan secured the leading position, attracting 1,450,000 tourists. The UK trailed behind, recording a slightly lower but impressive figure of 800,000. Lastly, the USA was outperformed by all other countries, with the lowest number of tourists, at only 500,000. In 2005, while Japan experienced a significant decline to 1,100,000, the quantity of tourism in the UK and the USA soared to similar figures of 1,500,000 With regard to accommodation options, backpacking took the first place at the beginning of the period, in 1995, with roughly 1,700,000 tourists choosing this type. Before the volume of backpacking declined dramatically to around 1,300,000 by 2005, there had been a peak at 2,500,000 in 2000. The number of visitors choosing to stay at hotels witnessed a steady rise from 250,000 to 1,300,000 in the final year of the period, which was nearly equal to that for backpacking, with approximately 1,250,000.
Sample Detail
The bar chart below shows how tourism to Australia from three different countries changed between 1995 and 2005. The line chart illustrates the types of stay that tourists chose during the same period.
22/07/2026 05:39 7.5 points
Topic
The bar chart below shows how tourism to Australia from three different countries changed between 1995 and 2005. The line chart illustrates the types of stay that tourists chose during the same period.
Word count: 248
Chart/Graph
Essay
Overall Scores
7.5±0.5
Good
Writing Criteria Scores
TA8.0
CC8.0
LR7.0
GRA8.0
Click on any highlighted text in the essay to view detailed suggestions for improvement.
Deep Analysis
Task 1 - Academic Writing
4 tools available
Sample Essay - IELTS Writing Task 1
No sample essay
Click the button below to analyze and generate a high-quality sample essay for Task 1.