
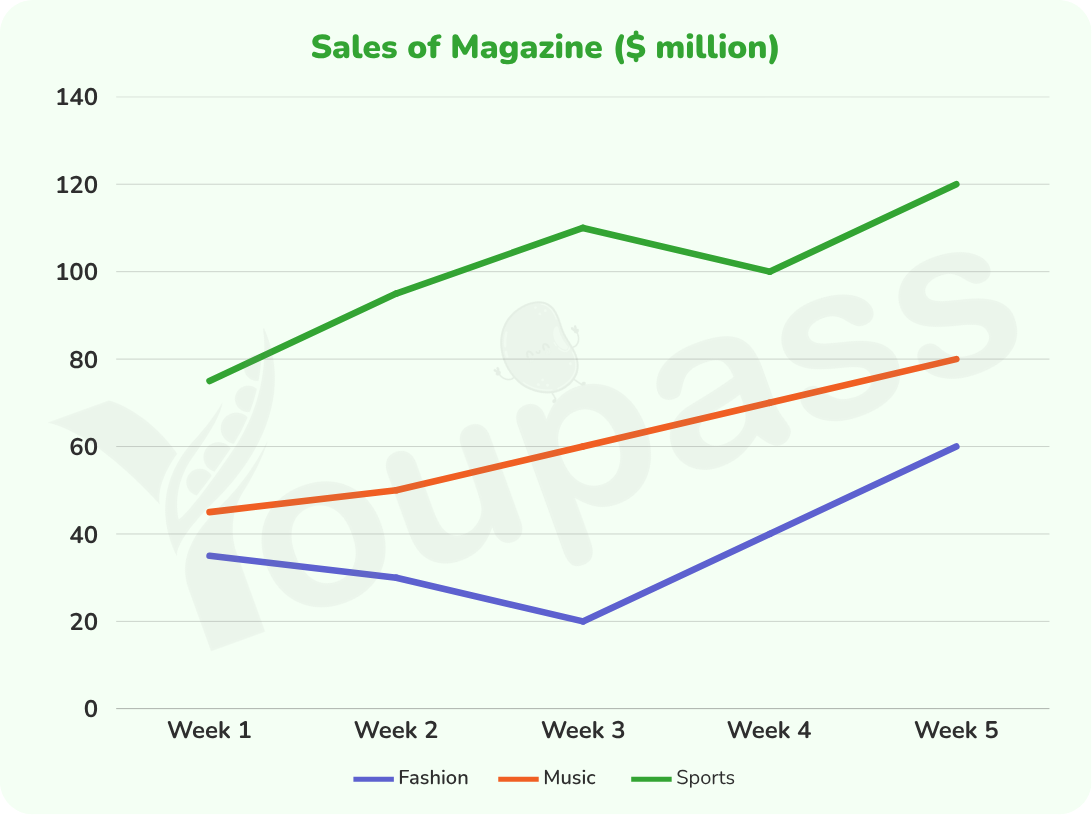
The line graph illustrates sales of magazine in three domains in a particular region throughout five weeks. Overall, sales of three groups showed an upward trend, while the category of fashion and sports displayed fluctuating patterns. Regarding the revenue of sport magazines, the largest level compared to other groups; starting from nearly 77 million, it saw a dramatic increase to 115 million in week 3 before it dropped significantly to 100 million in week 4 and rose gradually to 120 million until the last week. Furthermore, the sales of fashion exhibited the smallest value over file weeks; characterized by roughly 27 million from the beginning. Then, the figure plummeted to 20 million in week 3. However, it recorded a relatively remarkable level at 60 million in week 5. In contrast, the monetary returns of the music category represented the negligible process without any noticeable volatilities. The figure showed a steady and uninterrupted climb from 42 million to 80 million during five weeks.
Sample Detail
The chart below shows sales of three categories of magazines (fashion, music, and sports) in a particular region over five weeks.
22/07/2026 05:39 6.0 points
Topic
The chart below shows sales of three categories of magazines (fashion, music, and sports) in a particular region over five weeks.
Word count: 162
Chart/Graph
Essay
Overall Scores
6.0±0.5
Fair
Writing Criteria Scores
TA6.0
CC6.0
LR6.0
GRA6.0
Click on any highlighted text in the essay to view detailed suggestions for improvement.
Deep Analysis
Task 1 - Academic Writing
4 tools available
Sample Essay - IELTS Writing Task 1
No sample essay
Click the button below to analyze and generate a high-quality sample essay for Task 1.