
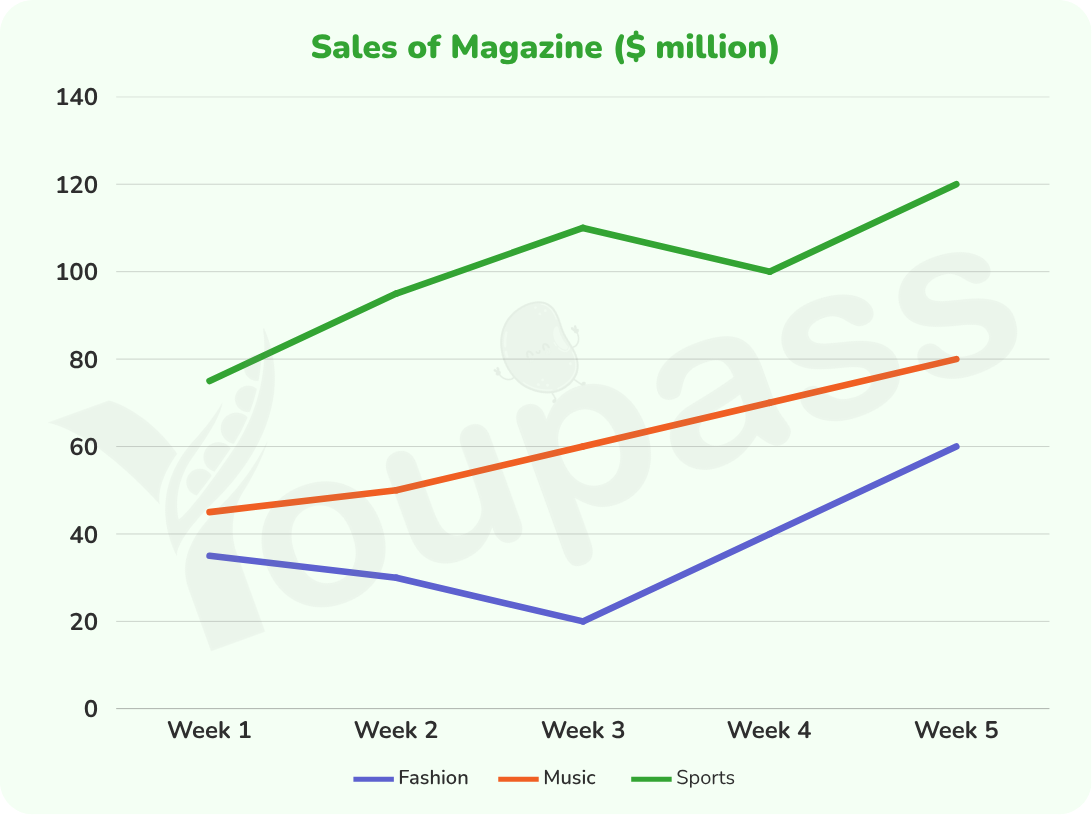
The line graph illustrates sales of magazine in three domains in a particular region throughout five weeks. Overall, sales of three groups showed an upward trend, while the category of fashion and sports displayed fluctuating patterns from week 1 to week 5. Regarding the revenue of sport magazines, the largest level compared to other groups; starting from nearly 77 million, it saw a dramatic increase to 150 million in week 3 before it dropped significantly to 100 million in week 4 and rose gradually to 120 million until the last week. Furthermore, the sales of fashion exhibited the smallest value over file weeks; characterized by roughly 35 million from the beginning. Then, the figure plummeted to 20 million in week 3. However, it recorded a relatively remarkable level at 60 million in week 5. In contrast, the monetary returns of the music category represented the negligible process without any noticeable volatilities. The figure showed a steady and uninterrupted climb from 42 million to 80 million during five weeks.
নমুনা বিস্তারিত
The chart below shows sales of three categories of magazines (fashion, music, and sports) in a particular region over five weeks.
22/07/2026 05:41 6.0 স্কোর
টপিক বা বিষয়
The chart below shows sales of three categories of magazines (fashion, music, and sports) in a particular region over five weeks.
শব্দ সংখ্যা: 168
চার্ট/গ্রাফ
Essay
সামগ্রিক স্কোর
6.0±0.5
মোটামুটি
রাইটিং মানদণ্ড স্কোর
TA6.0
CC6.0
LR6.0
GRA6.0
উন্নতির জন্য বিস্তারিত পরামর্শ দেখতে প্রবন্ধের হাইলাইট করা যেকোনো লেখায় ক্লিক করুন।
গভীর বিশ্লেষণ
Task 1 - Academic Writing
4 tools available
নমুনা রচনা - IELTS Writing Task 1
কোনো নমুনা রচনা নেই
টাস্ক ১-এর জন্য উচ্চমানের নমুনা রচনা বিশ্লেষণ এবং তৈরি করতে নিচের বাটনে ক্লিক করুন।