
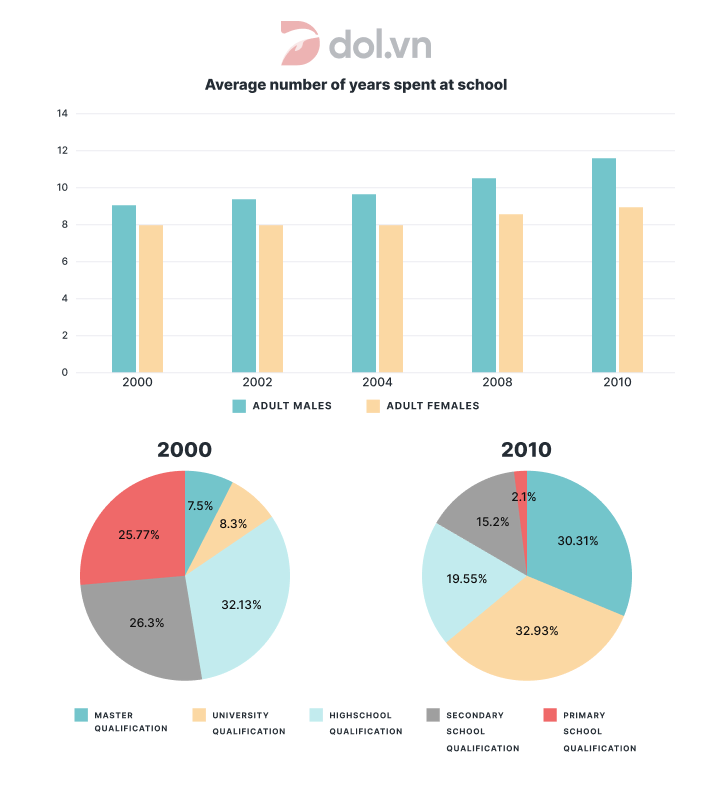
The given diagrams provide a detailed breakdown of participation levels in education and the five certain qualifications between 2000 and 2010 in Singapore. What is most striking when looking at the data is that the average number of years adult males spent at school was consistently higher compared to those of women throughout the given period. It is also noteworthy that there was an upward trend in the figures for both male and female adults. Furthermore, while high school qualifications were the most popular among adults in 2000, the proportion of people having a university qualification topped the chart in 2010. Looking first at the average number of years spent at school, adult males spent approximately 9 years, which moderately surpassed the figure for female counterparts, at 8 years. In the following four years, the average number of years both men and females spent at school was relatively stable before gradually increasing to nearly 12 and 9 years respectively by the end of the time frame. Turning to the highest level of education, high school qualification accounted for the highest figure, at 32.13%, followed by secondary and primary school qualifications, with each standing at 26.3% and 25.77% respectively in 2010. In contrast, university and master qualifications were among the lowest figures, accounting for only 8.3% and 7.5% in the first year. By 2010, the proportion of university and master qualifications had grown significantly, whereas the opposite was true for primary, secondary and high school qualifications. Specifically, the former categories rose to 32.93% and 30.31% correspondingly, a growth so pronounced that pushed their figures up to the first and second position in the overall ranking. Other sectors, meanwhile, varied, ranging from 2.1% to 19.55%.
নমুনা বিস্তারিত
The charts show average levels of participation in education and the highest education level of adults from 2000 to 2010 in Singapore.
22/07/2026 06:28 7.0 স্কোর
টপিক বা বিষয়
The charts show average levels of participation in education and the highest education level of adults from 2000 to 2010 in Singapore.
শব্দ সংখ্যা: 283
চার্ট/গ্রাফ
Essay
সামগ্রিক স্কোর
7.0±0.5
ভালো
রাইটিং মানদণ্ড স্কোর
TA7.0
CC8.0
LR7.0
GRA7.0
উন্নতির জন্য বিস্তারিত পরামর্শ দেখতে প্রবন্ধের হাইলাইট করা যেকোনো লেখায় ক্লিক করুন।
গভীর বিশ্লেষণ
Task 1 - Academic Writing
4 tools available
নমুনা রচনা - IELTS Writing Task 1
কোনো নমুনা রচনা নেই
টাস্ক ১-এর জন্য উচ্চমানের নমুনা রচনা বিশ্লেষণ এবং তৈরি করতে নিচের বাটনে ক্লিক করুন।