
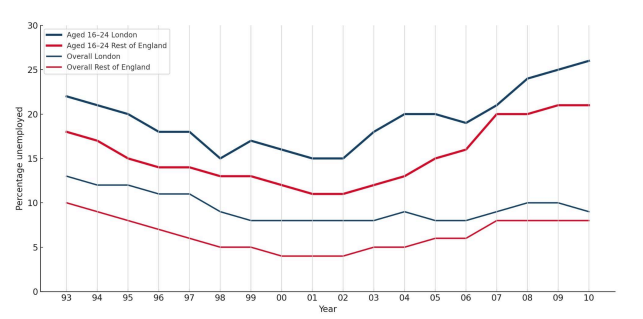
The line graph compares levels of unemployment among 16 to 24-year-olds with overall unemployment figures over a period of 18 years in England. Overall, unemployment rates for young adults were consistently higher than those for the overall population. Although all four categories declined during the first half of the period, they recovered afterwards, with the most notable increases of young adults. In 1993, around 18% of English 16 to 24-year-olds living outside London were unemployed, but the figure for those living in London was 5% higher, at 23%. The overall unemployment rates in London and the rest of England were lower, at around 13% and 10% respectively. During the following 8 years, the share of young adult unemployment experienced slight decreases to around 16% in London and 13% in the rest of England before rising dramatically to more than 25% and around 21% respectively in 2010. Furthermore, the reverse patterns can be seen for the overall population in London and the rest of England, with slight decreases to around 10% and 9% respectively between 1993 and 2010.
Detail Sampel
The graph below shows changes in young adult unemployment rates in England between 1993 and 2010. Summarise the information by selecting and reporting the main features, and make comparisons where relevant.
22/07/2026 06:30 7.0 skor
Topik
The graph below shows changes in young adult unemployment rates in England between 1993 and 2010. Summarise the information by selecting and reporting the main features, and make comparisons where relevant.
Jumlah kata: 177
Grafik/Diagram
Essay
Skor Keseluruhan
7.0±0.5
Baik
Skor Kriteria Writing
TA7.0
CC7.0
LR7.0
GRA7.0
Klik teks yang ditandai di esai untuk melihat saran detail untuk peningkatan.
Analisis mendalam
Task 1 - Academic Writing
4 tools available
Esai contoh - IELTS Writing Task 1
Belum ada esai contoh
Silakan klik tombol di bawah untuk menganalisis dan membuat esai contoh berkualitas tinggi untuk Task 1.